I’ve been thinking about Adobe (ADBE) for a couple of weeks since I read the cover story in Barron’s. ADBE hasn’t climbed since the article and its option premiums are good. Schaeffer’s research rates ADBE 5 – again, not much help. The chart seems to be pointing up and worst case sideways. I bought 100 shares in my IRA for $42.66 and immediately sold a covered call near the money for the June 42.50 call (AEQFV) for $2.00 and received $189.25 after commissions. I planned to write it OTM, but decided to go the safer route. Safety in my IRA is key to me. Like I said, I think ADBE will be flat, worst case. If it stays flat or goes up I still will end up with a 21+% annualized gain. Selling the covered call OTM could have given an annualized return of 43% if ADBE closed above 45 in two months (highly likely according to Barron’s) or a decent 12% annualized gain if it stayed exactly where it is now.
Now I’m down to $2238 in cash in my IRA and can really put my focus back to my brokerage account. Actually, if ADBE dips some, I’ll likely sell a naked put on it.
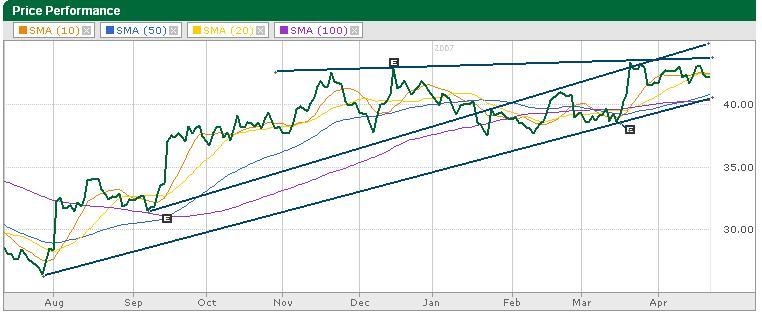
Click on the thumbnail for a full chart.