
A reader asked me to chart the PowerShares QQQ Trust (QQQQ) this week instead of the Dow like I usually do. I haven’t charted it in a while, even just to glance at and since I’ve been reading so much recently about the tech stocks being a safer haven I figured it was a good idea. Mixing up the weekly view is probably a good idea to keep the full perspective of the market a little fresher anyway.
For those not familiar with the QQQQ, it’s a unit investment trust designed to closely mirror the Nasdaq 100. The top 10 holdings of the QQQQ account for 40% of the entire trust comprised of mostly technical stocks and no financial stocks. QQQQ can be used to buy puts on while remaining long on some of it’s biggest holdings.
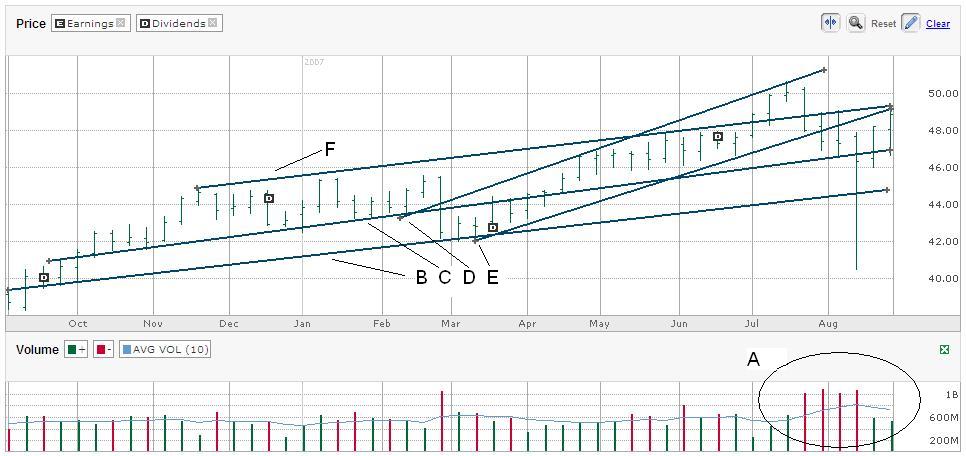
I looked at the QQQQ weekly chart for the past year and found a lot to think about. First is the circle I drew at the bottom marked A. This shows the volume from the past month and a half. What’s scary is the four weeks of higher than normal volume when the QQQQ was sliding only to next hit two weeks of weaker volume during the positve weeks. That shows the good times weren’t getting a lot of buy in and the QQQQ could come back down when heavier volume returns.
Moving to the trend lines… Line B is the longer-term trend of higher lows and is around 45. Hopefully that’s the lowest it’ll go in the near-term aside from the blip a few weeks ago that took it below 41. Line C is another long-term line that hasn’t held as strong, but has provided support more often. We dipped below that line last week before a good rally. Line D is the upward trending line that started as a bottom in February and has since been a ceiling for higher highs since then. It has likely overshot its use for a while. Line E was the trend line of higher lows that went with the Line D run, but after it was broken at the end of July it became a ceiling for new highs. Interestingly, Line F, which is the more stable trend line of higher highs coincides with line E at the high of last week. That was a strong point to collide and could be the site of the QQQQ near-term highs.
With all of this said, I think the QQQQ is due for a little pullback before it breaks out to new highs. If the QQQQ gets above 50, it could easily hit 55 before taking another breather, but I could see it down to 47, if not 45 before that happens.
Click on the thumbnail below for a full sized chart.
Technorati Tags: investing, stocks, trade, stock chart, QQQQ, trend lines, finance