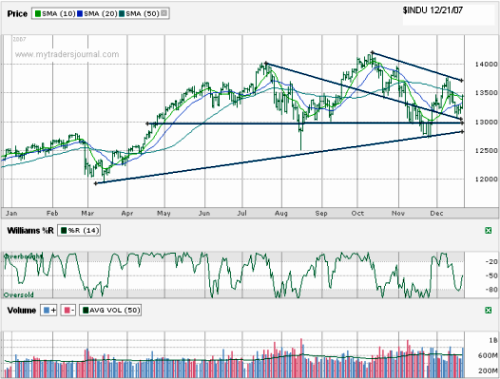
I’m keeping this week’s Dow Jones Industrial Average (aka DJIA or $INDU) brief this week since it’s a holiday week. The chart below tells the same story as last week, we’re still stuck in a trading channel. What we can’t say for sure yet is which way we are likely to break or even when yet. I don’t think it will be in the next two weeks in either direction.
A possibility exists that the markets could move big with volume low this week and next, but once the volume returns, a sense of normal behavior should come with it. The best bullish indicator the DJIA saw last week was that we closed on Friday above the 10, 20 AND the 50 day moving averages for the first time since 12/10/07. Until something big happens, I see the 13,000 range as likely (light) support. I’m sticking with my neutral sentiment that I changed to a little over a week ago. That doesn’t mean it won’t be volatile, but just a lot of fuss about nothing.