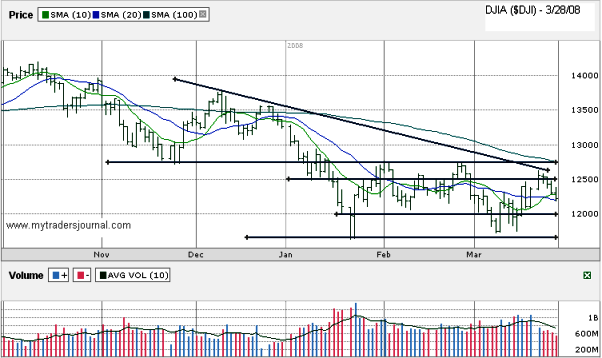
The Down Jones ($DJI) remains range bound still as we finish off the end of the first quarter on Monday. It appears to be destined to stay within a few hundred points of 12,000 and 12,500. A longer-term down trending line helped to keep it within this range as the DJIA tried to angle up on Monday.
The DJIA has been above its 10 day moving average for more than a week until Friday when that finally broke. Luckily the 20 day was just below that point to offer support. If the 20 day continues to provide support, the 10 day will be able to have a fighting chance to come back into play. The longer the DJIA stays below the 10 day, the worse it is in the near term.
I’m not making any huge bets until I us below 12,000 again and back on an upswing. Caution should be your friend until we actually find some solid legs again. I’d also like to see the VIX above 30 again before diving in too deep too soon. Once traders get completely used to this trading range and consider it a guarantee is when it will break.