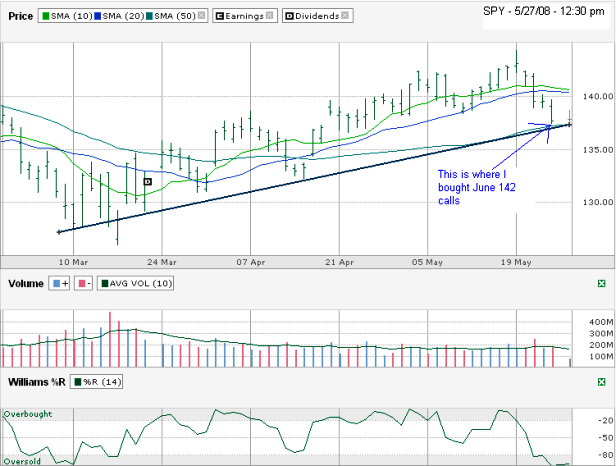
I hope everyone had a nice long weekend. I did. I’m slow getting back to investing as I busy at work on such a short week. This is my big play of the week, maybe. I bought a couple of calls on Friday and wrote about it here. The key for what I need to happen is for the chart to hold up and let the trend line of the higher lows and the 10 day moving average continue to provide support. If those lines work, SPY will be up this week. If not, I’m out $200.
I’m using this move because I am bullish on the SPY chart below, but worry that oil will rain down some pain on stocks’ earnings soon and we’ll see another decent pull back. I don’t want to sell many new naked puts until I see a bigger pull back and oil drops in price. On the other hand, I don’t want to miss an opportunity. This play gives me small exposure while limiting my downside.