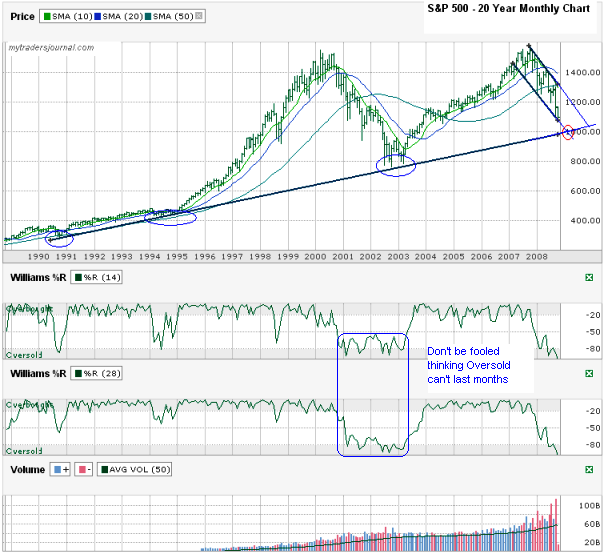
I went back a full 20 years to see where the S&P 500 (SPX) is on a longer term chart’s perspective. I only drew three trend lines in this week’s chart. I also drew (in blue) extensions to these lines to show where they might intersect.
- The long trend line that started in the early-90s and hit again in the mid-90s and in late 2002 and early 2003 is close to being touched again. The latest trading channel is on a collission course for it around 1,000. That’s 100 points (9%) below where the SPX closed on Friday. This past week’s losses (114 points) make me feel like we’re in a race to get there, but the chart shows that we’ve already gone as low as we “should” for this month. Believing that too much could cost you some money if the markets don’t want to do what this chart says. If we flatten out for three weeks and then have four weeks of a slide that equals last week’s fall we’d hit that line. It’s a reasonable target.
- The lastest trading channel’s trend line of lower lows just met up with the SPX’s fall which could mean an area of brief support, but I’ve seen a few of my individual stocks break support lately which makes me weary.
- The top side of that trading channel, the trend line of lower highs, gives some room for a rally, but I can’t help but think it might be a hard line to beat with this 20 year trend line working like powerful gravity. If the SPX can break this line, I might actually believe in a rally to have legs.
The bailout bill didn’t seem to make the markets think the bottom was in yet, but maybe the expected upcoming 50 basis point cut coupled with an EU cut could give us something to be pleased with. Copper and other commodities are at a three year low. The SPX fell more than 9% last week, that could be the capitulation we’ve been waiting for. Times are bad – numbers from housing and employment remind us of that each week. Eventually the billions of dollars from congress and the Fed’s rate cuts will pay off. The question remains, when?


Interesting, looks like we’re on the same page. I didn’t have the Williams% on my analysis, very cool. Hopefully we don’t break down from 10k.. http://www.distressedvolatility.com/2008/10/dow-index-analysis-10000-key-long-term.html
-D.Volatility
Did you notice that the S&P 500 went as low as 1,007.97 on Monday? I was only 8 points away from calling it exactly. After that it cut today’s (Monday 10/6/08) losses in half.
We always tell people that stocks can remain in oversold conditions for long periods of time. I feel it’s important to look for a near-term bottom to trade off of now that we’ve broken the key support levels on the indexes.
Some very good analysis work there, it’s quite interesting how much the figures jump around to be honest, and also quite scary!
Well done, keep it up 🙂