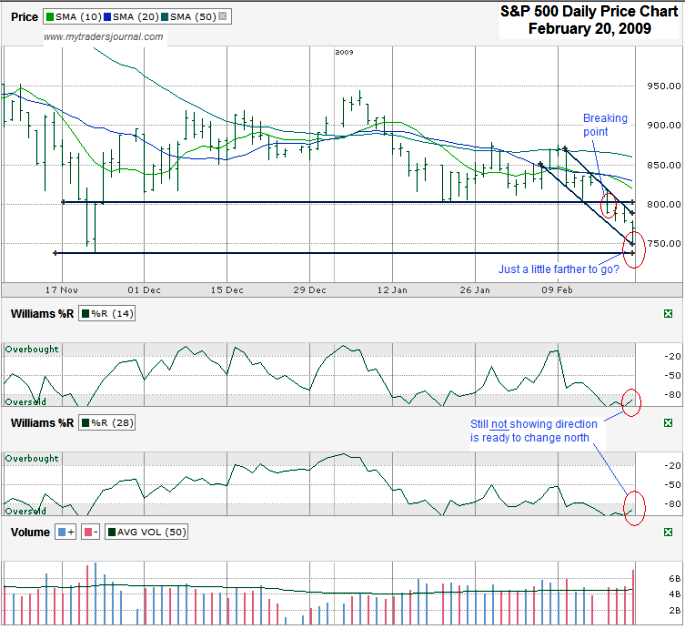
While the Dow Jones Industrial Average broke through its November low by a full 200 points, the S&P 500 ($SPX.X) has yet to fully test its November 21st intraday low of $741.02. It made it down to $754.25 before 1:30 on Friday, but closed up 15 points from there. To me, the S&P 500 chart is the one to watch this week. I’d like to see it come down and fully test the $741 level. If it holds support, we could be in for a decent bounce, if not a longer bear market rally. The reason to watch it so carefully this week is that if that $741 level breaks we should expect a steep sell off after that just as the SPX did after the $800 level broke at the beginning of last week.
This break might not happen on Monday so don’t get excited too soon. The SPX Chart shows we’re in a short downward trading channel and just bounced of the trend line of lower lows. I don’t expect to see the trend line of lower highs break until we’ve traded much closer to $741. This trading channel is steep enough that we should have an answer for direction this week. The kicker to confirm we’re breaking out of this nose dive will be to watch the Williams %R each day. Once it breaks out of oversold I think we’ll have a much safer bullish trade to make. Until then you are catching a falling knife and are likely to bleed bad. Safe is a relative term here. Fundamentals are still scary, so whatever happens I suggest hedging. The only point I might not do this in the near future is if we get a good capitulation day like November 21, 2008. I might sell naked puts out of the money and accept some risk if I see the masses panicking. So far the fall has been orderly and that makes me stay nervous.


I’ve been watching that level very closely too. It looks like we might potentially start a big downward move. We have to break out of this sideways trend someday.