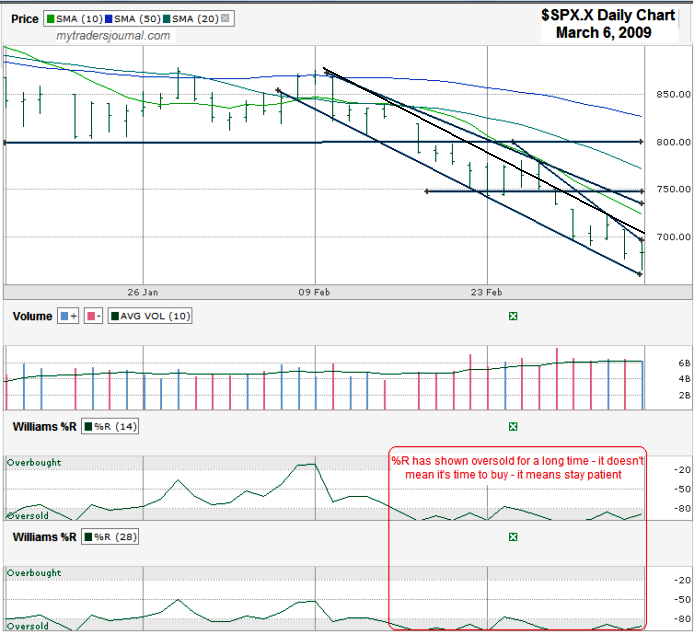
When I wrote about the S&P 500 Chart two weeks ago I said I expected the 741 line to hold support, but if it broke to expect a steep sell off. Well, it broke and dropped another 75 points in just a few days (which happened to be an intraday low of 666 and change for those who like the macabre). The break below 741 took a few days to play out. It bounced around 740-750 for a couple of days and then hit the same down trending line I drew today as I did two weeks ago (the thinner line below). The SPX actually made it above that line, but couldn’t close above it. After not being successful at a true breakthrough the decline continued and the path of least resistance was down.
Where do we go from here now that we know how the past has played out? I’m not turning into a bull yet. We had a small up day on Friday, but the high stopped right where two short trend lines of lower highs pass through and fell back in the middle of its trading range for the day. The volume for the past full week was almost dead-on average each day, thereby not adding any weight to the bull or bear case as much as the blah feeling that is trickling around the market. We’re far below the 10, 20 and 50 day moving averages, so we could get a bump up to any of them, but then there’s Williams %R.
Williams %R which is an indicator for oversold/overbought conditions is still in oversold as it has been for weeks. That doesn’t mean we should be jumping in now. It means we need to remain patient. The SPX has been in oversold for three weeks already. That’s longer than most spells down there, but doesn’t mean it’s going to end tomorrow. It might, but like I said two weeks ago %R still isn’t showing the direction is ready to head north. We need to see a break out from the oversold area. That might make us miss a day or two of potential profit, but if you heeded my warning from the February 20th chart I’ll bet you’re happy you didn’t rush in before the fall that hit the SPX since then. All that said, be ready for a rally soon – just don’t get in before the indicators say you should.


Good analysis on the %R. Indications such as that one are often overlooked. All the same, I’m ready to take on a bullish position because I don’t think it’s possible to predict when we’ll hit the bottom. I consider myself more of a fundamental investor, and I just know that almost the entire S&P 500 is undervalued.