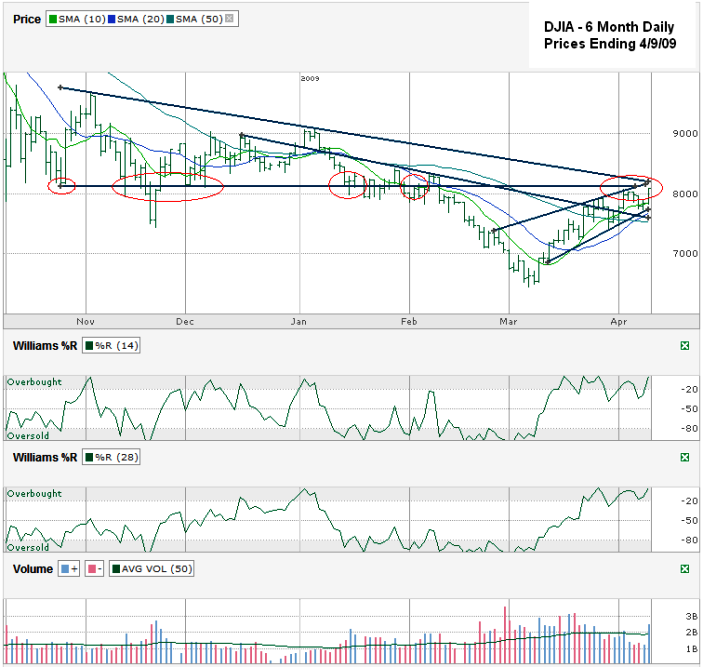
I charted daily prices for the Dow Jones ($DJI) for the past six months ending Thursday, April 9, 2009. Outside of any other technical indicator the big scary monkey on this market’s back is the horizontal line that comes across the entire past six months right near the highs of the past six trading sessions. A lot has hype has been generated about getting past 8,000 for the DJIA. (I’m guilty of the same round number targeting). The real line to watch is a little above that round number, closer to 8,140 – 8,150. This past week the DJIA hit 8,087 and the week before it hit 8,075. The last day of the trading week this week we closed within four points of the session high. The last day of the trading week the week before we closed within two points of the high of the day. I’d love to call those strong bullish indicators, but it all comes back to that horizontal line that’s looming. If that inability to break above that horizontal line isn’t menacing enough, the trend line for the past six months worth of lower highs just met up with that horizontal line to give another high hurdle to make it over.
Now, even with all that said, this chart a bullish side too. Williams %R is still showing bullish momentum and the trading channel for the past month to month and a half is moving higher. The DJIA also moved above a shorter trend line of lower highs recently and then came back to test that trend line already. The DJIA touched its 10 day moving average at the low on Thursday and held support although it broke below intraday the two prior days. Volume on down days has been low and has been higher on positive days.
This is clearly a key point we’re sitting on to find out where the markets could move over the coming weeks. The two trend lines I mentioned that were and are the lines of lower highs could become a new trading channel going down further or the shorter trend lines of higher lows and higher highs could stay in tact and the DJIA could break through 8,150 next week. As always, I want to see multiple closes above that mark before I jump in with two feet. Even using 8,000 as the mark to beat, the Dow has not closed above it twice in a row on this current run yet.
Want stock charts through the week? Visit Chart-Analysis.com for regular updates.

