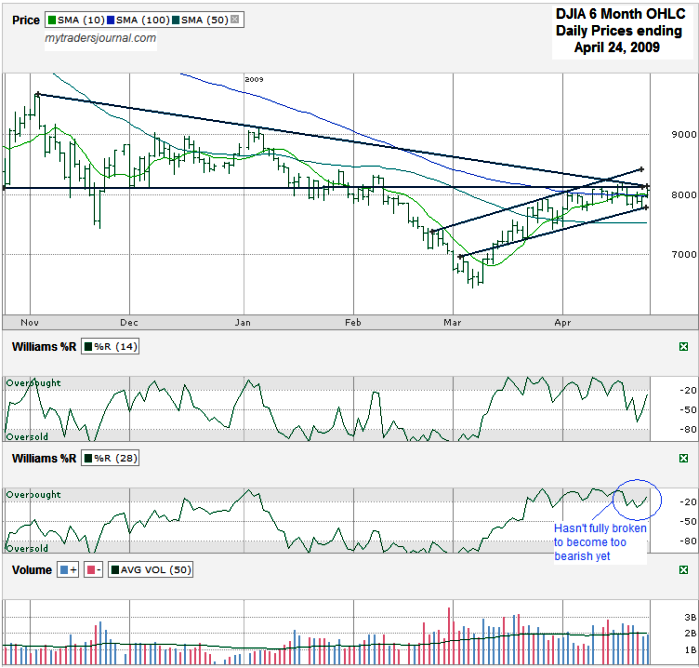
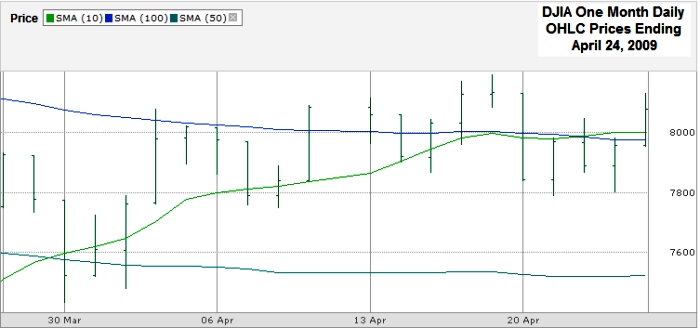
Today I’m posting two views of the Dow Jones ($DJI) chart. One is for the past six months and the other is only for the past one month. On the six month chart I attempted to draw the same trend lines as I did two weeks ago with my April 9th Dow Jones Chart.
I found it interesting to see that each of the four trend lines is still intact, but that should change this week as they start bumping into competing support and resistance lines. The barrier I talked about two weeks ago around 8,140 – 8,150 is still tough resistance to the top. In addition the long down trend line of lower highs held this week with keeping the DJIA’s high a little lower than last week’s intraday high. At the same time the trend line of higher lows held support. With a couple of days of room for error in my basic drawing they should connect this week forcing one to lose its control of the trend.
In the six month chart you can see that although Williams %R indicator broke for 14 day period, the 28 day period only had one day below overbought. One day without a following confirmation day is not enough to consider it a true break, so the rally could continue based on this indicator. That makes it hard to pick a direction for the next week based on Williams %R.
The one month chart shows the moving averages better, especially since I didn’t draw trend lines over them. I typically use the 10, 20 and 50 day periods for simple moving averages (sma), but this week I switched the 20 day with the 100 day sma because the 20 day sma didn’t seem to have much influence lately and the 100 day could be an area of support if the $DJI makes it that low again. Also worth pointing out is at the end of March when the 10 day sma moved above the 50 day sma creating a bullish cross over. On Wednesday the 10 day sma moved above the 100 day sma. That’s another bullish cross over, but I’m hesitant to get on that bandwagon too soon after seeing the 10 and 100 day moving averages act as resistance. I want to see a couple of days of confirmation above that area to become a true believer and that takes us back to the trend lines above.
This week is going to be huge in deciding the next month’s direction for the Dow Jones. Watch those trend lines I drew above and the moving averages I drew below. Whichever direction wins should be noticeable in both and I expect Williams %R will be a day behind it.


