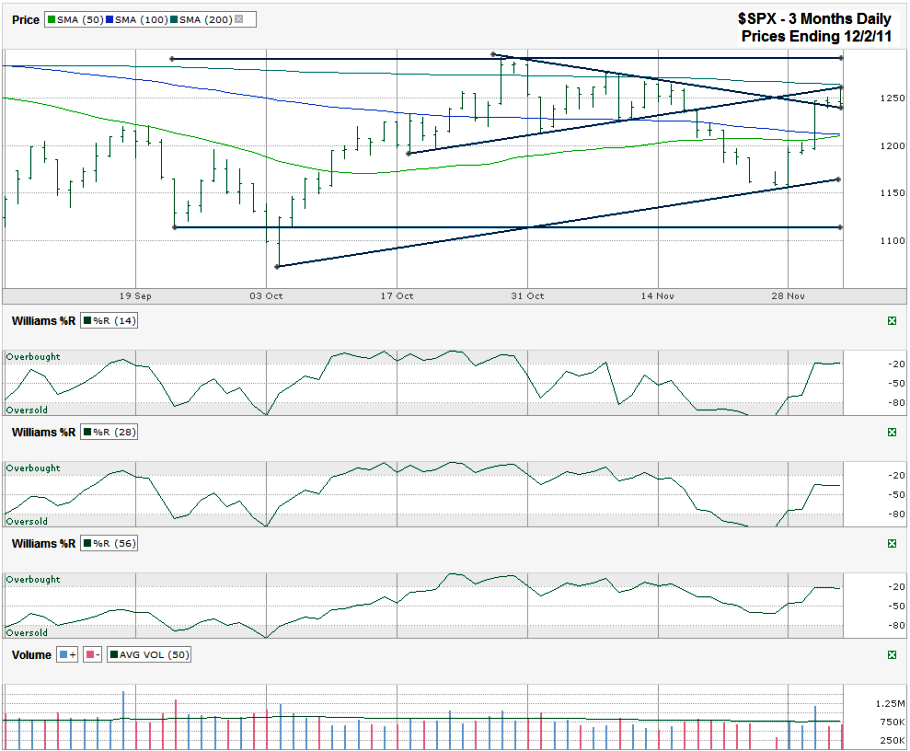
This S&P 500 ($SPX) chart shows the past three months of daily prices after the index finished the week at 1,244.28 on Friday, December 2, 2011.
The large cap index just finished its second best weekly point gain ever, but is facing resistance from its 200 day moving average (dma) now. Although the SPX has made it above the key moving average this fall, it hasn’t closed above it for three consecutive days since July.
One bright spot comes from the bullish break of resistance from the trend line of lower highs. This past week’s rally took the index above this trend line only to see it use the same line as support the next two days. The line that was once resistance could (as it often does) turn into support, albeit with a declining trend. At the same time the line that was ascending support for two months in the form of higher lows now appears to be acting as resistance. This sets up an expanding wedge where the days’ highs and lows could get wider until a new trend is found.
The 200 dma will have to break resistance before this upper line of resistance can come back into play for more than another day. To the downside, support could come from the 50 and 100 dma which just converged. The 50 and 100 dma are actually showing a bullish crossover. The index tends to be at the cusp of a multi-month trend when these two moving averages cross. For now this trend favors the bulls which means this past week’s 7+% gain might just be the beginning. The Williams %R indicator is also favoring the bulls. At the end of Thanksgiving week the indicator literally ran off the bottom of the chart for its 14 and 28 day periods. This is an extremely rare occurrence and showed an excessively oversold market. This aided the bulls when shorts were squeezed out of their positions and were forced to buy back their positions.
If history does not repeat itself and the bears have more fight left in them, the S&P 500 could fall back to its lower ascending trend line of higher lows that started with this year’s low and touches the Thanksgiving week low. This trend line is the next major line after the moving averages that computer based algorithmic traders will be watching and a break below this could send the index back down closer to the 1,100 area. If history does repeat and this is the beginning of a new long term uptrend, the bulls will have to be patient before going all in until the October high of 1,292.66 is taken out. This is the magic line for the computer models and a close above this line should send in mass buy orders over the following days. That line is almost 4% above Friday’s closing level and leaves a lot of room for day traders to toy with longer term investors before patient bulls are fully rewarded.


