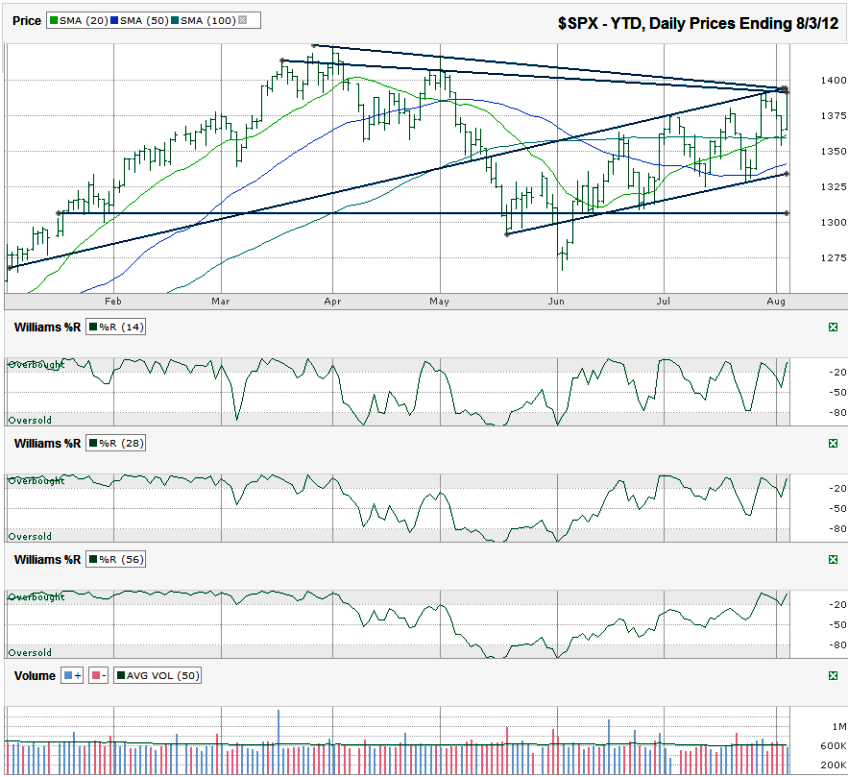
This S&P 500 ($SPX) chart shows the past year-to-date, daily prices after the index finished the week at 1,390.99 on Friday, August 3, 2012.
The path of the rally since the beginning of June looks more like a roller coaster’s route than a fun way to gain 100 SPX points. The beauty of such an up and down rally is that it has repeatedly shaken out the worried investors and kept the greedy at bay while maintaining a healthy ascent. I’d much prefer an upward trajectory that looks like this summer than one that does not give buying opportunities along the way. Prior to each buying opportunity came a selling opportunity. Now that the index is back up to its trend line of higher highs, is it time to sell again?
It’s hard not to think taking some profits would be wise here, but the downside might be limited. Along with the trend line of higher highs potentially acting as resistance, two trend lines of lower highs have come back into play. I included two here because the one that starts from a higher point uses only two extreme days. The lower one uses points that came into play more often. Both tell the same story. A reason for the bulls to be nervous is upon us. The downside could be as shallow as the 20 and 100 day moving averages (dma), which would only take the SPX back down to Friday’s opening levels, not quite 2% lower. The 50 dma and the trend line of higher lows is approximately 3.4-3.8% lower. That’s a relatively shallow dip that will be hard to crack below unless some major macro-economic news hits the wires. Simple recurring fears from Europe shouldn’t unhinge stocks much more than that in the near term – not with an election around the corner. The months leading up to an election typically favor the bulls. If something unexpected hits the markets, the chances of a fall below previous support (around 1,305) would be a mini-correction of 6% from Friday’s close and should be followed by another lurch higher.
For now, the 20 dma is in a bullish pattern above the 50 and 100 dma. These moving average crossovers tend to foretell weeks, if not months, of better days for the bulls. It’s not a flawless indicator (typically late in spotting a reversal), so watch the Williams %R indicator too. The recent surge brought Williams %R back into overbought territory again for the 14, 28 and 56 day periods. Another fall below overbought will be one of the first signals that sentiment has changed and cash might be a better allocation for our money than stocks. As volatile as the market is these days, I’d hesitate before shorting, even if the indicators suggest a bigger correction has started. If the S&P 500 index falls below 1,300, my opinion could change.


