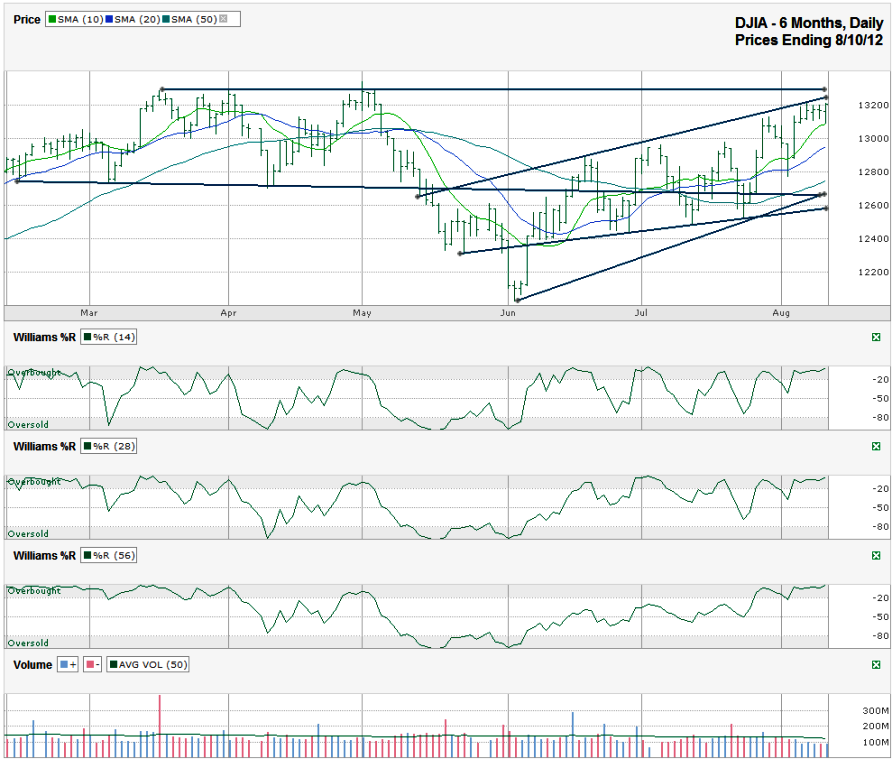
I charted the past six months of daily prices for the Dow Jones Industrial Average ($DJIA, $INDU, $DJI, the Dow) after the index closed at 13,207.95 on Friday, August 10, 2012.
The DJIA has had a fantastic run since the first week of June. Just as I commented in last week’s SPX chart, this index has also had a similar, healthy run higher. The (not exactly) two steps forward, one step back type of rally is the kind I like to get behind, just not necessarily after the two steps higher portion. It’s the ones that go straight up that scare me for how big the correction will be. However, the Dow is riding along its trend line of higher highs and is due for a move back into its trading channel. This past week saw the bulls refuse to give up the fight, but they didn’t have enough firepower left to produce sizable gains again. Sometimes we can see a chart move sideways long enough to open up more “space” for another step higher, but every move like this calls for some caution.
The DJIA touched its 10 day moving average (dma) on Friday before it found support. The 10 dma is still ascending quickly and should offer the first signal of a change in sentiment when it breaks support. The 20 dma will be the next potential area of support for the large cap index followed by the 50 dma. The 50 dma is close to a trend line of higher lows which will be interesting to see how it plays out. The more reliable trend line doesn’t take in the June low, but uses the more frequently tested trend line. This latter trend line is currently around 12,600, about 4.5% below the recent intra-day high. This is the line I expect to hold support and offer a good buying opportunity.
Since the 10 dma hasn’t broken support yet and the Williams %R indicator still shows momentum that favors the bulls, it’s hard to want to sell yet. The argument against staying long and blind comes from the horizontal line running close to the 2012 highs. Retesting previous areas of resistance often prevent indexes and individual stocks from breaking higher on a first attempt. For investors who do not use options (why don’t you?), a trailing stop about 1% below the current price of your ETFs and stocks could save some bigger losses while leaving a lot of upside possible. For those of us who use options, selling new covered calls above previous resistance will soften the next dip while leaving a little upside possible. Put option sellers should consider waiting for a drop of 2% or more before adding too much exposure. Along with the ability to use lower strikes, volatility should increase some and help premiums rise. Since August options expiration is this coming Friday, the week could be fairly volatile and might be an ideal time to initiate new positions on a dip.


Seems like buying out of the money puts would also be a good option. Any perspective on this strategy?
I’m not sure buying OTM puts is a good strategy here because any dip might not be enough to push them into the money and make up for the premium you would have paid. In the money options might be a better move if you want to buy puts right now.
Of course, I could be wrong and the markets could correct more than I expect. Either way, buying puts would give more downside protection, I just don’t think it’s needed yet.