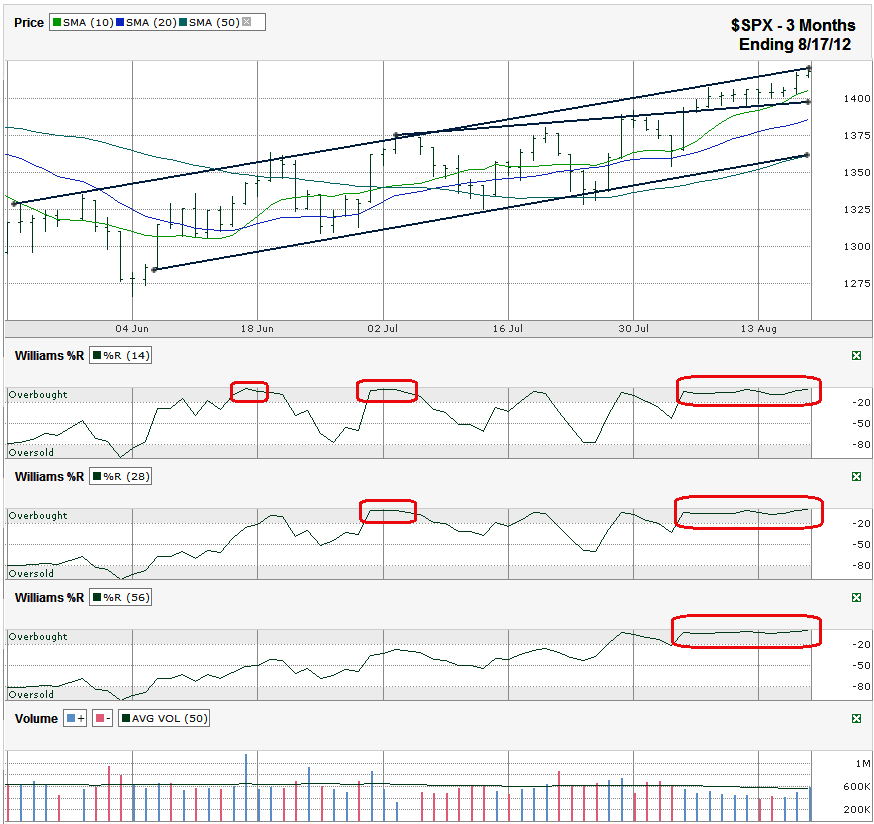
This S&P 500 ($SPX) chart shows the past three months of daily prices after the index finished the week at 1,418.16 on Friday, August 17, 2012.
The sideways movement of the past couple of weeks gave just enough room for the SPX to bump up a little higher in the final two days of the week to touch the trend line of higher lows again. Thursday was the biggest gain of the week and came when the 10 day moving average (dma) caught up to the large cap index. The support from the moving average gave a nudge to the collection of stocks enough to bounce it out of its doldrums.
The index should break out of its morass more definitively now that it is up against an ascending ceiling and above its 10 dma. The two technical indicators have it sandwiched in a tight trading range which won’t last for long. Whichever side gives first should let us know where to expect the next few weeks to move.
The first couple of road blocks to the upside will be the 2012 high of 1,419 and the four year high of 1,426. To the downside, the trend line that was resistance and then turned into support in August might be a short-lived area of support. If it breaks, the 20 dma the next hurdle for the bears to push over around 1,387. Then it gets more interesting. The 50 dma and a longer trend line of higher lows are running together, not much above 1,360. A dip to this area would give the S&P 500 a 4% mini-correction. This could be all that’s needed to bring in the buyers again while keeping the SPX within its trading channel. A fall outside of this trading channel could open the opportunity for a test around the 200 dma, close to 1,330, 6% lower. The chances of a real correction that takes stocks lower than that is not very likely, so I’ll save the analysis for when a turn lower begins later on.
The Williams %R indicator is still cruising along in the overbought territory. That in itself is not a sell signal or really even a warning signal. The fact that the 14, 28 and 56 day periods are all there makes it more noteworthy. This doesn’t mean there is impending doom. When we see the next sell off that takes all three time periods below overbought is when bulls should worry. Before that, we’ll have warning signs from the 14 and 28 day periods alone. A break below 1,360 might bring out a break for the 56 day period, so the indicators should be flashing together by then. In addition, the 10 dma will have moved below the 20 dma before then which will be another sell signal. For now, those signals aren’t flashing and volume hasn’t surged as it typically does at major market tops. All might not be clear sailing from here, but the end of this rally is not upon us yet.


