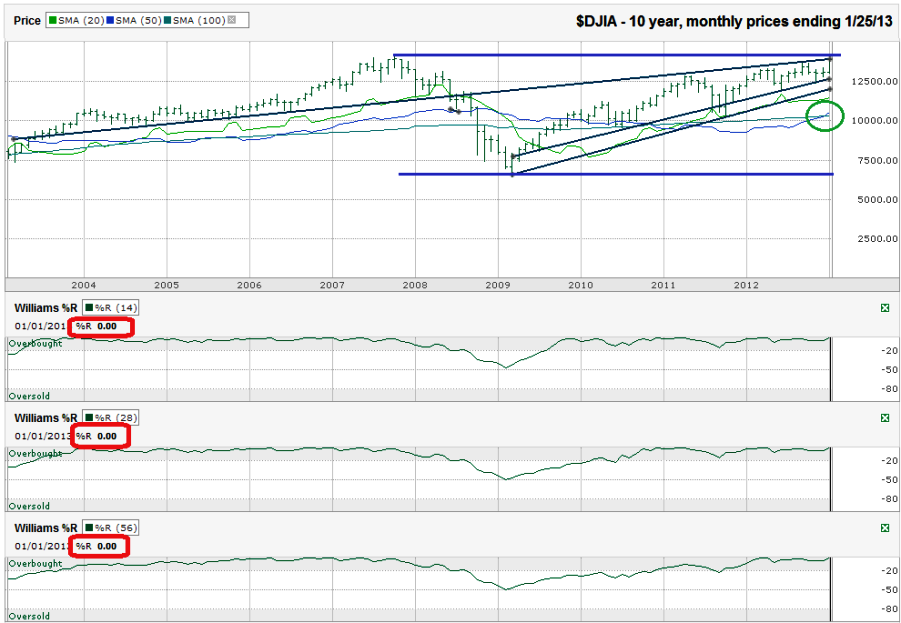
I charted the monthly prices for the past 10 years on the Dow Jones Industrial Average ($DJIA, $INDU, $DJI, the Dow) after the index closed at 13,895.98 on Friday, January 25, 2013.
The media has been talking about the Dow’s proximity to its all time high with every tick higher. I thought this deserved a chart looking back over the past 10 years to try to forecast what’s on the horizon for the large cap index. Horizontal lines marking stock and index previous highs can act as resistance. That’s the obvious first challenge for the Dow. 14,198.10 was first touched in October 2007. It wouldn’t be uncommon to see a failure on the index’s first revisit to the area.
To add to the challenge, the 10-year trend line that was once support and has recently been resistance is blocking much more of a move higher. The Williams %R indicator hit 0.00 this month. Just as a reading of -100.00 can be bullish, this extremely rare occurrence throws up red flags for the bulls. However, it isn’t a sell-immediately type of signal. The warning is more for what’s around the corner in the next month or two. Once this current momentum slows, a sell-off from such extreme bullishness can be more severe than usual profit taking dips.
The moving averages tell two different stories. The DJIA has climbed farther away from its 20-month moving average than is normal. This gap between the moving average and index tend to result in a reversion to the norm and a meeting somewhere in between. On the bullish side, the 50-month moving average just crossed above the 100-month moving average. This is a bullish signal. Traders should take it with a grain of salt. Even with a bullish signal for longer-term pricing, indexes will often have a retest of their moving averages before taking another step higher, especially when they have such a large gap between the two points.
This all seems to add up to a limited upside and path of least resistance aiming lower, but only briefly. A correction can happen just as quickly as the DJIA has moved higher. Notice the trend lines of higher lows. If history repeats itself, as it often does, the Dow will retest its trend line(s) of higher lows. This could result in a decline of 8-10% from current levels. Such a correction would bring the moving averages to a more reasonable gap, reset Williams %R and open up a great buying opportunity, assuming support at the 20-month moving average holds when we get there.


