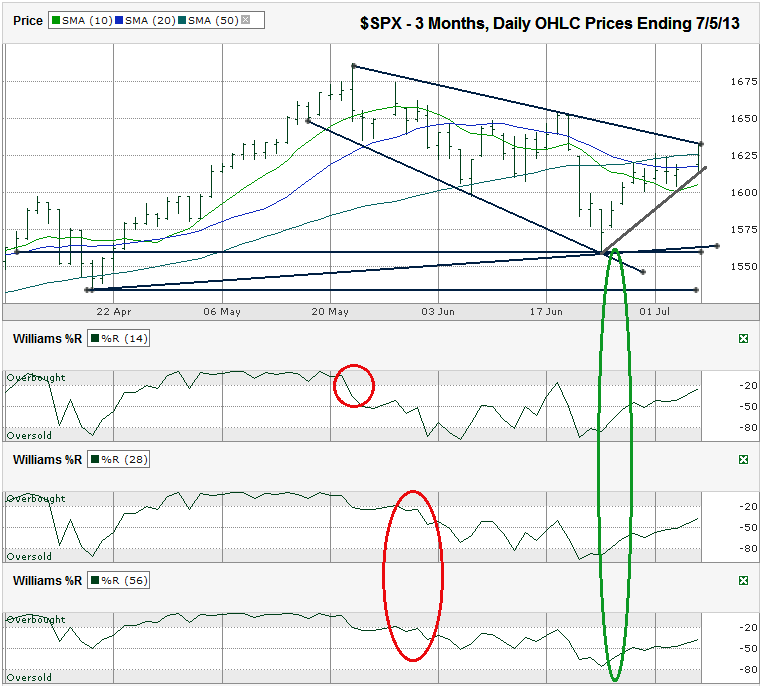
I charted the daily prices for the past three months on the S&P 500 index ($SPX) after the index closed at 1,631.89 on Friday, July 5, 2013.

The move lower was foreshadowed by the break in the Williams %R indicator. The 14-day indicator showed a break below overbought, which shows short-term sentiment has changed. This was the first red flag, but can be a false positive in a bull market. It wasn’t until May 31st when the 28 and 56-day indicators moved lower that the confirmation was in place and the chartists knew to get out of the way because the bears were taking over.The S&P 500 fell 7.5% from its recent intraday high to its intraday low. This hit the midpoint of the most popular calls for a correction of 5% and 10% and was enough to bring the bulls back into the market. The SPX had not corrected as much as 5% all year until the move lower began on May 22nd. A typical year has at least four 5% corrections and the longer span without such a reset is one of the reasons it overshot this time.
By June 5th, the 10-day moving average (dma) moved below the 20-dma and issued a second major warning to anyone still overly bullish. Soon after theses two bearish signals jumped out of the chart, the 50-dma held support, which gave hope to the bulls. The reversal didn’t last and once the 50-dma broke support, selling was the easy choice for traders. It only took a few days for the large cap index to find support again at its trend line of lower lows and a previous horizontal line of support at 1,560. Bullish signals started showing up the following day.
The Williams %R indicator showed a reversal in sentiment as it moved out of the oversold area on both the 14 and 28-day indicators. The 56-day indicator didn’t make it to the fully oversold area and this remains a reason to be cautious. Based on the Williams %R’s 56-day indicator, the selling didn’t complete its cycle and traders could be in store for another quick move lower again within the next couple of months.
The 20 and 50-dma acted as resistance after a few days of unchallenged market conditions. On Friday, the S&P 500 closed above its 50-dma for the first time since it peaked on June 18th (its only close above the moving average in June). The week’s closing high was at the new resistance level marked by a trend line of lower highs. The coming week will be very telling for which direction the market will move next. If the 50-dma holds support, without crossing back and forth intraday, the bulls will clearly be in charge again and new all time highs could be on the horizon. Traders should watch for the 10-dma to overtake the 20-dma again for a true confirmation the next leg of the bull market is in play. If the trend line of lower highs maintains resistance, the 50-dma will not hold support and the market could quickly follow a course to retest its June 24th intraday low or even its April 18th low, 5% below Friday’s close.