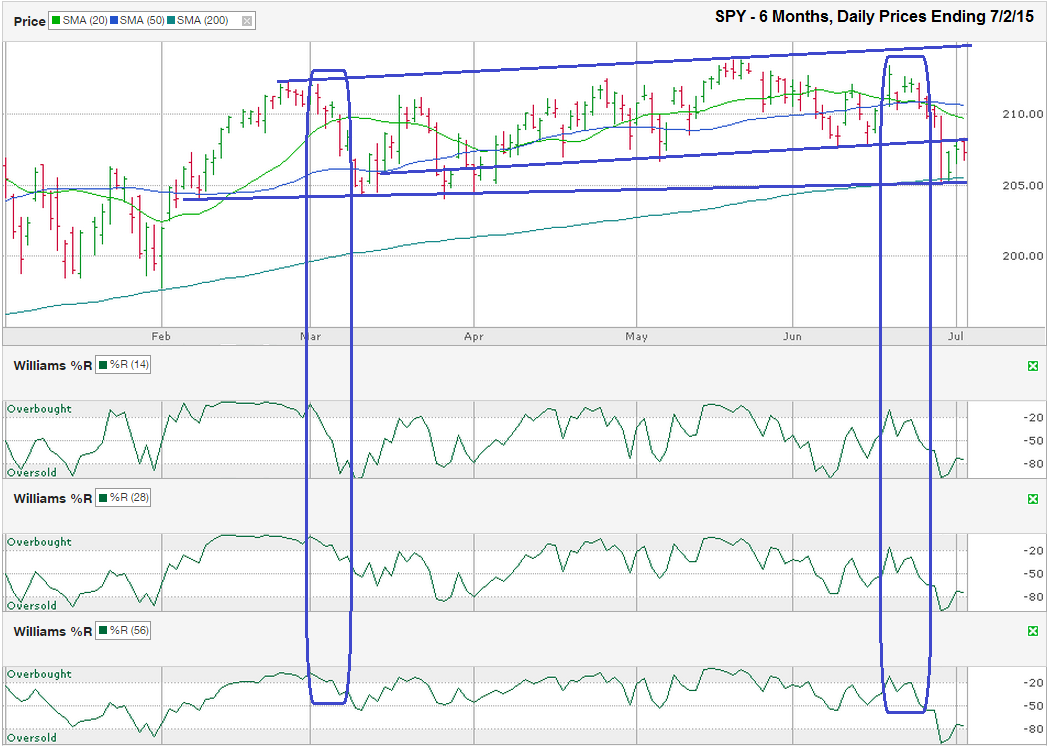
The chart below shows the daily prices for the past six months on SPY, an S&P 500 Index ETF, after closing the week at $207.31 on July 2, 2015.
The trend line of higher lows that started in February wasn’t the only indicator that came into play this week. The 200-day moving average coincided with the trend line to provide a second reason for the selling to stop. The 200-day moving average has been a solid line of support during the current bull market. SPY has only taken one trip below it since November 2012 and traders will be watching this line carefully to see if it can hold through the latest headlines again. Traders should keep an eye out for a close below the 200-day moving average and treat it as a bearish indicator.SPY has traded in a fairly narrow ascending trading channel for the past five months. The range of the channel narrowed even more over the last three months, until last week when the large-cap ETF dropped to the bottom of the longer channel. Once again, the longer trend line of higher lows offered support for the index and stocks began to climb again.
Bears expect the three-month trend line of higher lows that was support to become resistance now that SPY has traded through it. Bolstering their case, SPY could not move above this line in either of the past two sessions. It is highly unlikely that this extremely narrow trading range from the past few days will last much longer. Debt issues in Greece and Puerto Rico or the upcoming corporate earnings announcements will push stocks sharply in one direction in the near-term.
The Williams %R indicator will give an early prediction on the new sentiment shift. Just as it did in March, Williams %R signaled the mini-correction in the second half of June too. For the first time in five months, all three time indicators fell into the oversold area in this past week’s slump. While getting there is bearish, coming out of this gray area is bullish. Traders need to be careful not to assume that one or two days above the gray area is enough. The move needs two or three confirmation days to validate the shift in sentiment and those days should not include a down day, as we saw on Friday.
Monday will be an important day of trading to see how the markets react to Greece’s vote on Sunday. Based on the media hype from most of last week, it shouldn’t take more than a day or two to decipher where stocks are headed. The opening reaction in the first 30 minutes of trading will not necessarily dictate the direction that will follow in the coming weeks. Traders will need to be cautious with their moves.
A rally from the lows might not have much room to run beyond the highs from May. Resistance should come into play around $215, near the top of the upper trend line of higher highs, only $8 above Thursday’s close. A bearish move has approximately the same room to fall. If the 200-day moving average and the longer trend line of higher lows breaks support, SPY could drop quickly to where support caught SPY throughout the winter months, around $198, only $9 below Thursday’s close. A decline of this magnitude would only give SPY a 7% retracement, still not a technical “correction” of 10%. Longer-term investors should ignore much of the noise surrounding Greece and concentrate on the value of their stocks as corporations release their latest earnings.


