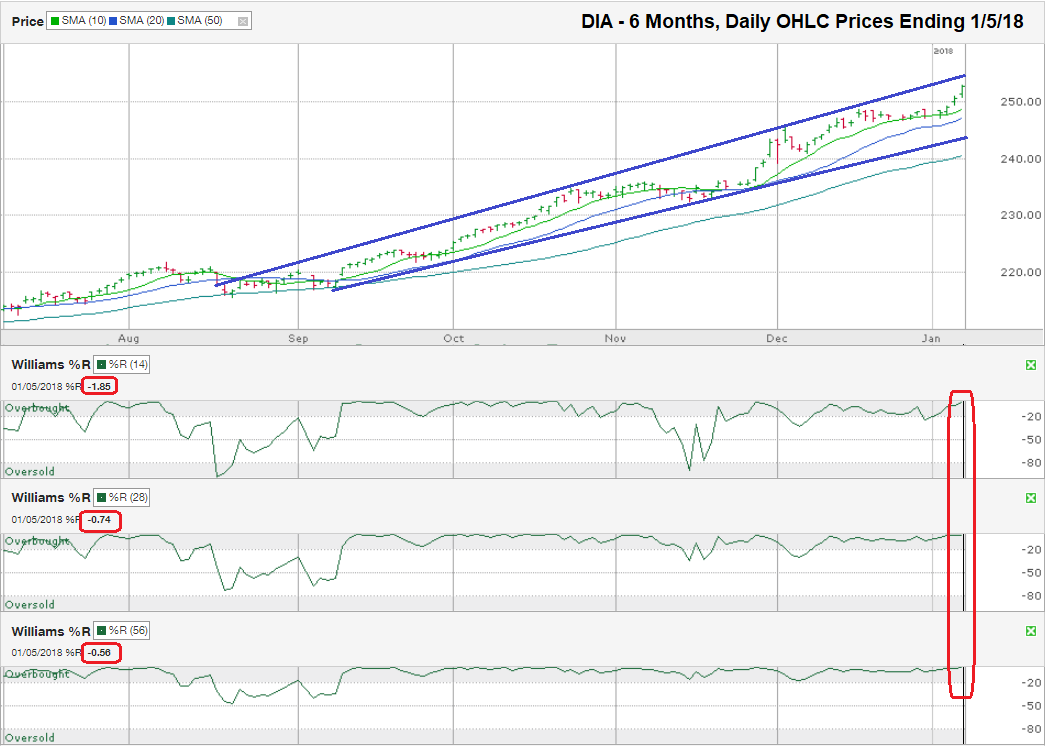
The chart below shows the daily prices for the past six months on DIA, an ETF that tracks the Dow Jones Industrial Average, after closing the week at $252.72 on January 5, 2018.
DIA finished Friday within a few cents of its all-time high set only five minutes before the close. Such a strong close at the end of a day, and even more so at the end of a week, illustrates how investor sentiment has swung to an extremely bullish outlook. Investors didn’t want to end the week without having as much money invested as possible. This rush to buy could be more of a bearish indicator from a contrarian point of view because there are very few bears left. When bears become scarce, it leaves few buyers who are not already fully invested and that’s when stocks tend to hit weakness. The American Association of Individual Investors survey showed 58.8% bullish in its most recent survey compared to the historical average of 38.5%. Only 15.6% of those surveyed considered themselves to be bearish. That’s nearly half of the 30.5% historical average.
These qualitative numbers complement what the more subjective technical analysis shows – the market may be overbought and due for a correction finally. I only drew two trend lines on this chart. The lower line shows the trend line of higher lows and the upper line shows the trend line of higher highs. When the large-cap ETF hits the upper trend line it tends to take a break and move sideways, if not lower. When the ETF revisits the lower trend line, it finds support and moves higher. Eventually this trading pattern will break higher or lower and the trend will change. As of Friday’s close, DIA is close to where it could find resistance to higher prices again and will begin the retreat towards the lower line.
The trend line of higher lows is less than 4% below Friday’s close. If DIA follows the pattern of the past few months, this 4% drop would be exactly what the index needs to reset again before resuming its rally. Once traders see support from the lower trend line again, the buyers will jump back into their bullish stances and push stocks higher. Cautious investors need to wait for support and possibly miss the short-term low before allocating more cash reserves into the riskier investment. Aggressive buyers can enter their orders when DIA gets close to the ascending trend line and risk support not working this time.
The three moving averages shown on this chart are the 10, 20, and 50-day moving averages currently at $248.56, $247.08, and $240.51 respectively. Each of these moving averages could provide temporary support for the ETF. Each break below a moving average is another reason for the bears to gather momentum and pull stocks lower. A decline to the 50-day moving average would be a 4.8% drop, but even if the stocks began to decline on Monday, the moving average would continue inching higher and might meet DIA closer to a 4.0% decline, the biggest drop for the Dow in over a year. I didn’t include the 100 and 200-day moving averages at $231.96 and $221.85 respectively, but they will be worth watching if the 50-day moving average breaks support. The 200-day moving average is 12.2% below Friday’s closing price. A drop of 10% is considered a “correction” by definition and can be a catalyst for bulls to return. The DIA would be very close to its 200-day moving average with a correction such as this, which could offer a second reason for buyers to return to the market.
The Williams % R indicator shows overbought and oversold conditions. A stock or index can remain overbought or oversold for weeks or months at a time (see the past four months on the 56-day indicator at the bottom of the chart). The change in sentiment is what matters. When Williams %R falls below the gray overbought area in each of the three periods noted on this chart, traders know a price decline could be more severe than the usual daily and weekly ebbs and flows. Williams %R is close to extreme overbought levels as of Friday’s close, which throws up a warning signal, but not enough to abandon a thriving market yet. The warning sign could switch to an obvious sell signal soon and will keep traders’ attention as we wait for the inevitable correction. I still see this market as one that investors should buy the dips, but we don’t have to rush into any dip before we see the falling knife has landed.


