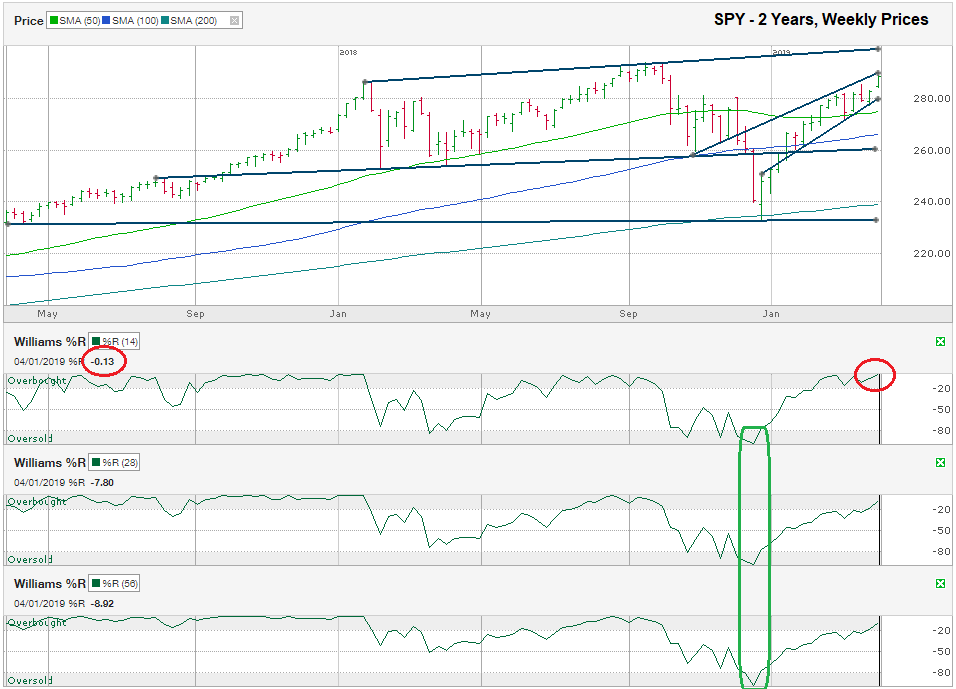
The chart below shows the weekly prices for the past two years for SPY, an S&P 500 index ETF, after closing the week at 288.57 on April 5, 2019.
SPY has moved higher in a tight trading channel since its low on December 24, 2018. As of Friday’s close, the large-cap ETF rested at the top of that narrow trading channel marked by its trend lines of higher highs and higher lows. At a glance, technicians would normally call for the next move to be lower, towards the trend line of higher lows. The price action may play out like that, but the downside is limited to around eight points in this scenario. This tight range makes it something to watch, but not something bulls should fret over unless support at the lower trend line does not hold the prices within its upward trend.
The more important trading channel is the longer one that goes back to the summer of 2017 on the low side and early 2018 on the high side. The downside risk within this trading channel is approximately 9% lower from Friday’s close. The upside potential is close to 4%. In most investors’ eyes, that ratio is not the risk/reward balance we’re looking for. Bulls will have to expect this resistance line of higher highs to break and allow the S&P 500 more upside room to move. Bears are starting to lick their chops in the hopes of a return to $260 for SPY, if not all of the way down to its lowest trend line of lower lows. This bottom trend line could offer support after an 18% decline. If stocks fall this low on a reaction to the technicals, value investors and technical traders will back up their trucks to buy as much as possible at depressed prices during an economic cycle that’s still expanding.
The 200-week moving average might help stop SPY from reaching the lowest trend line, but only by $5-10 based on the current spread between the two indicators. In other words, we should expect to see cash coming off the sidelines on the buy side if SPY reaches the lower $240s.
The Williams %R indicator helps validate the call for limited upside, maybe. This technical indicator has a definite art to it versus a completely black and white signal sometimes. For now, the 14-week period indicates an extremely overbought market. Ideally, to signal a sell warning, the 28 and 56-week indicators should match the 14-week’s signal, as we saw in late December when all three timeframes lined up to signal a buy call. This is where the “maybe” part of the prediction comes in. If SPY reaches the upper trend line of higher highs within the next two weeks, the 28 and 56-week indicators for Williams %R should show an extreme overbought signal at the same time.
If the upper trend line acts as resistance to higher prices, the Williams %R indicators show momentum has moved too far too fast, and the SPY is 25% above its 200-week moving average ($300 SPY and $240 200-week moving average), then the bears will be in the catbird seat with a huge gap to fill to the downside.


