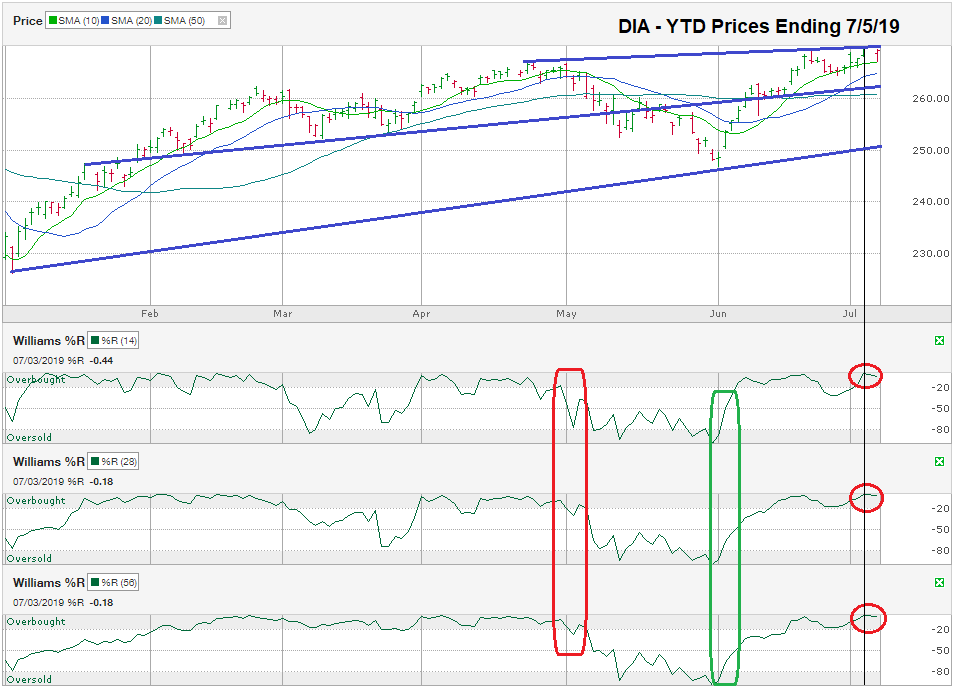
The chart below shows the daily prices for the year-to-date through July 5, 2019, for the Dow Jones Industrial Average ETF, after closing the week at $269.27.
DIA moved higher quickly since bottoming at the beginning of June. The moving averages favor the bulls with DIA trading above its 10, 20, & 50-day moving averages. So far, the large cap index has found support along its 10-day moving average, but it faces a couple of technical hurdles now.
The Williams %R indicator points to changes in sentiment. Touches on the extreme levels of this technical indicator signal likely changes in market direction. On July 3, DIA nearly reached the absolute maximum overbought level, circled in small red circles. The same pattern hit in early May (shown in a single red circle) before stocks sold off sharply. The reverse, close to absolute levels of being oversold (circled in green), emerged at the beginning of June as stocks began their recovery. If the indicator is correct again, stocks will move lower soon.
DIA has traded in a wide trading channel this year and the trend line of higher highs is acting as resistance again. This trend line could be enough to stop further price improvements until stocks can consolidate their gains after the Dow’s best June since 1938. At best, stocks might move more sideways than higher. At worst, the other technical indicators could be correct, and the Dow Jones index is due for another retreat.
The middle trend line drawn on this chart shows where DIA has faced both resistance and found support at different points. A drop to this line would equal close to a 2.0 to 2.5% decline before rebounding. That’s small enough to be part of the normal ebbs and flows of the market’s cycles. A decline to the longest line drawn, the trend line of higher lows, would be nearly a 6.5% drop. Historically, the market tends to have declines of 5% a few times per year and 10% at least once per year. This expected trading range means any near-term decline should not create a panic for those of us who have a time horizon of more than a few weeks or months.
On the fundamental side, data is mixed, but generally positive still with low inflation, strong jobs data, and firm housing prices. Unless the fundamental data change or a larger macroeconomic event changes the outlook, any near-term dip in prices will be a buying opportunity after stocks find their footing again.


