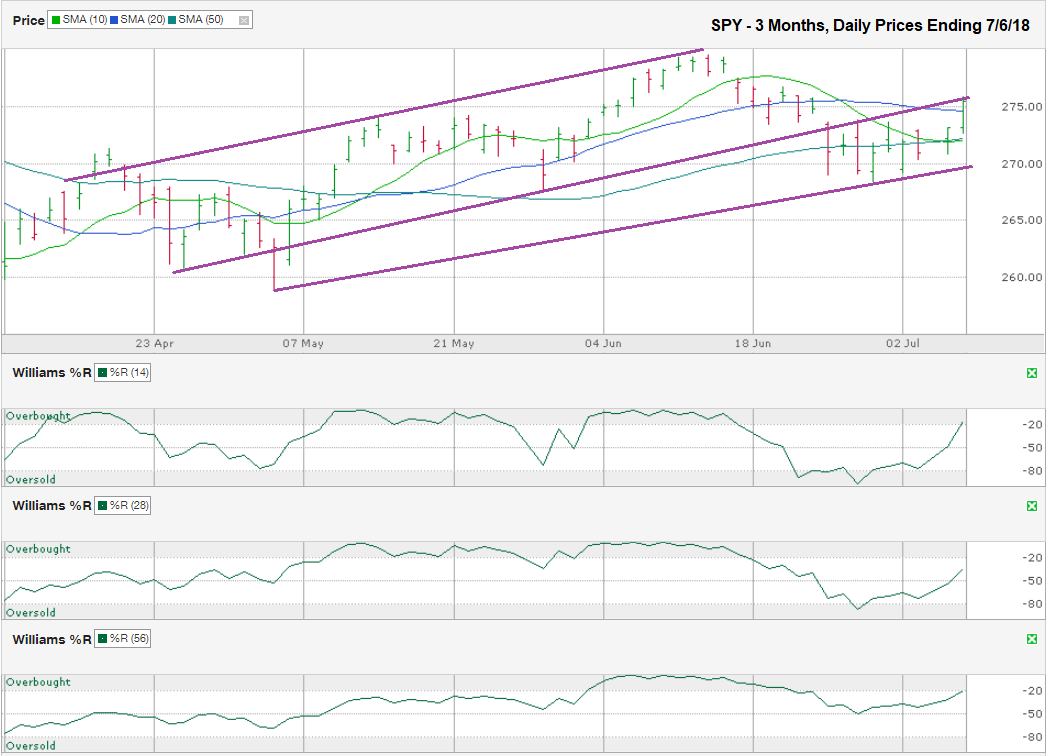
The chart below shows the daily prices for the past three months on SPY, the SPDR ETF that tracks the S&P 500 Index, after closing the week at $275.42 on July 6, 2018.
After a couple weeks of SPY hinting that it could roll over and have a healthy new mini-correction, it found its footing two Mondays ago. From a technical view, SPY was on the cusp of falling apart. The large-cap ETF fell below its 10, 20, and 50-day moving averages along with breaking below the trend line of higher lows that it had been following for two and a half months. Even the Williams %R indicator, which tracks momentum, signaled the times were changing for the bulls. And then everything changed again.
On June 25, SPY bounced off its intraday low and then meandered sideways for the next seven trading days. This sideways price action allowed the ETF to pull above its 10-day moving average again. Then on Friday, July 6, the momentum shift that began a few days earlier, coupled with a positive jobs report, enabled the index to move out of its short-lived sideways trading channel and it had its first day in nearly two weeks without trading below its 50-day moving average. This price surge brought SPY above its 20-day moving average by the close of trading too. The 10-day moving average, which had fallen bearishly below the 50-day moving average, leveled out and will move bullishly above the 50-day moving average again within a day or two, assuming nothing triggers a major sell-off this week.
Williams %R had another confirmation day above the oversold range of the indicator to give more credibility to the bulls’ return. While the 56-day indicator did not fall into oversold territory, it had fallen below its overbought range in late June and risked a signal that would have indicated a major longer-term sell. The recent uptick in bullish momentum negated that drop for now.
With most signals pointing in the bulls’ favor, stocks could have another great week. However, SPY has to get above the middle trend line in this chart first. This line was the line of support for the ETF, but it has turned into potential resistance. A price decline for SPY below $275 and even as low as $270 is not bearish. It could be a retest of the lower support trend line of higher lows and then the next attempt to break above the middle trend line will have a higher probability of success. Depending on political statements and macro-economic data releases this week, SPY might not need a retest of the lower trend line. Traders will be waiting for a bullish confirmation day on Monday, and possibly Tuesday, before buying with both hands again.


