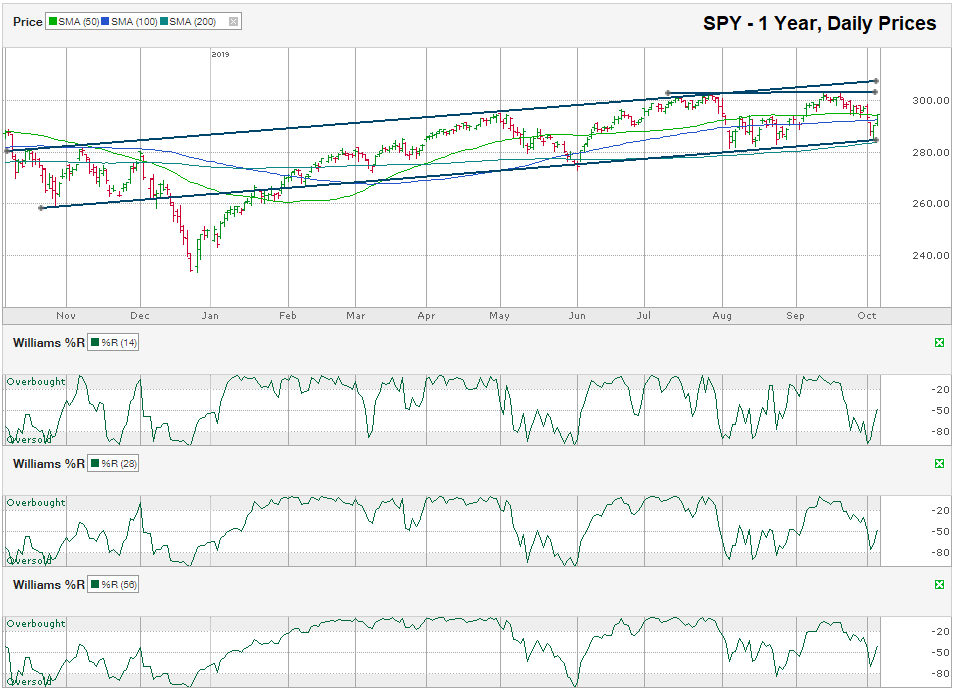
The chart below shows the daily prices for SPY, an S&P 500 ETF, after closing the week at $294.35 on October 4, 2019.
SPY has traded in a defined trading channel for the past year, except for the brief and harsh correction that hit stocks last December. Once stocks recovered from the panic selling, the large-cap index remained in a tight range for the next eight months and appears to have fought off the most recent attempt to push it below its trend line of higher lows.
This trend line of higher lows closely follows SPY’s 200-day moving average, which aided in offering support for falling prices. After finding support and bouncing off the intraday low on Thursday morning, SPY charged past its 50 and 100-day moving averages before the week of trading ended. Some of this rally was due to the increased probability for another interest rate cut that some traders still believe will benefit stock prices. Part of it was buying by algorithms and short covering triggered by the technical support noted above. The rest of the cause can be attributed to the idea that we might not be as close to a recession as some feared and traders didn’t want to miss out on further gains.
A retest of the 200-day moving average and the trend line of higher lows is possible before SPY pushes to new highs, but until these technical indicators break support, bulls don’t need to join the selling frenzy.
If SPY can remain above its 50 and 100-day moving averages this week, it will begin to climb towards its trend line of higher highs and then repeat the pattern until one side breaks out.
Just as in August, SPY’s Williams %R indicator did not give a signal that the ETF reached a complete capitulation last week. The 14-day indicator reached deeply enough into the oversold section for a technical reset of sentiment, but the 28 and 56-day indicators left technicians wanting more clarity. This lack of clarity is not a negative for stocks, but it’s not a positive either. It only leaves an opaque view of what could come next. Traders should continue to follow the trend lines for guidance and remain ready to act quickly in either direction when the trend lines, moving averages, and the Williams %R indicators align again.


