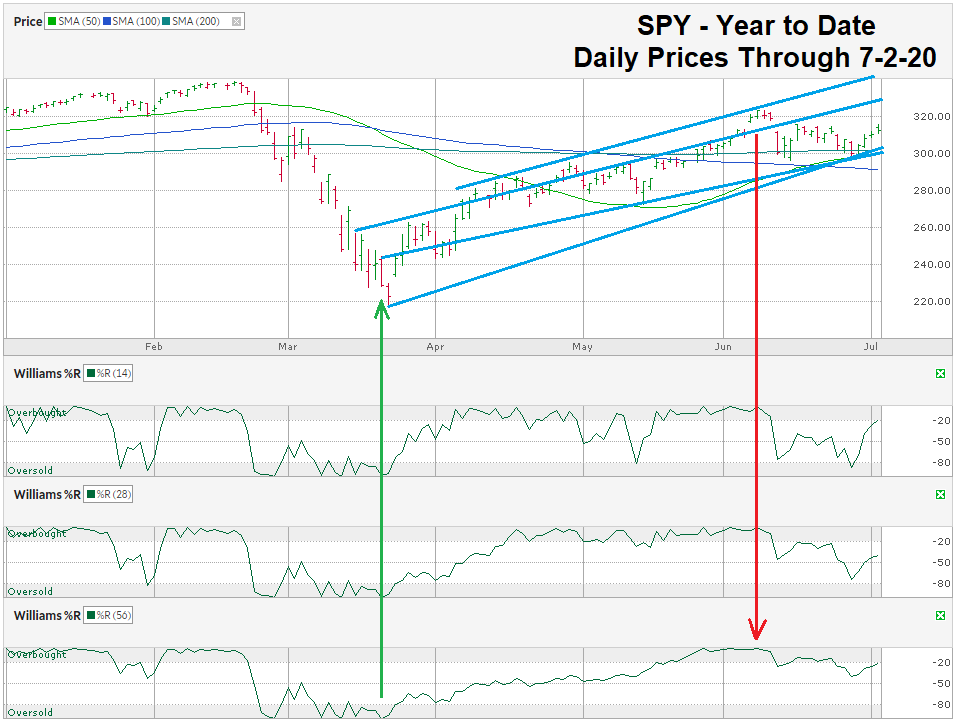
The chart below shows the daily prices for SPY, an ETF that tracks the S&P 500 Index, after closing the week at $312.23 on July 2, 2020. SPY is up more than 43% from its intraday low on March 23, but has struggled since hitting a three-month high on June 8, nearly a month ago.
The Williams %R technical indicator gave a false positive buy signal at the beginning of March, but was accurate on the second signal. This misleading signal is common when a stock or index falls deeply over a short period. In Wall Street’s unique jargon, this is called a “dead cat bounce” and most market veterans know to look for it before buying.
On June 8, Williams %R gave the reverse signal and buyers backed off, but didn’t completely abandon stocks again. Instead, they let prices correct a little before beginning the push higher last week. This pattern usually forms a second top that becomes a better selling point. As coincidence would have it, we are at the halfway point for two of the historically best weeks of the year on both sides of July 4.
Another week of positive movement for the large-cap index could drive prices close to the upper side of the ascending trading channel, shown in blue straight lines on the chart. After bouncing off of the trend lines of higher lows, the next area of resistance is more than 3% higher, with a possible extended ceiling more than 6% higher, closer to $330.
In my chart analysis last quarter, I said the small-cap index would act like a rubber band being pulled back to its 200-day moving average. This massive reversion to the mean is exactly what we saw in small and large-cap stocks. SPY is trading above its 200-day moving average now and the rubber band effect has lost its influence, but the 200-day moving average has continued to play an important role to technicians. Since trading above the 200-day moving average on April 27, SPY hasn’t fallen below it since.
The key technical indicators to keep an eye on are: 1) another sell signal on the Williams %R indicator, 2) a retest of the trend line of higher highs, and 3) a break below the 200-day moving average, as a signal the easy money is over. Without clear trendlines to the downside, the next area of support, after a break in upward momentum, could be at the intraday low of $272.99 on May 14.

