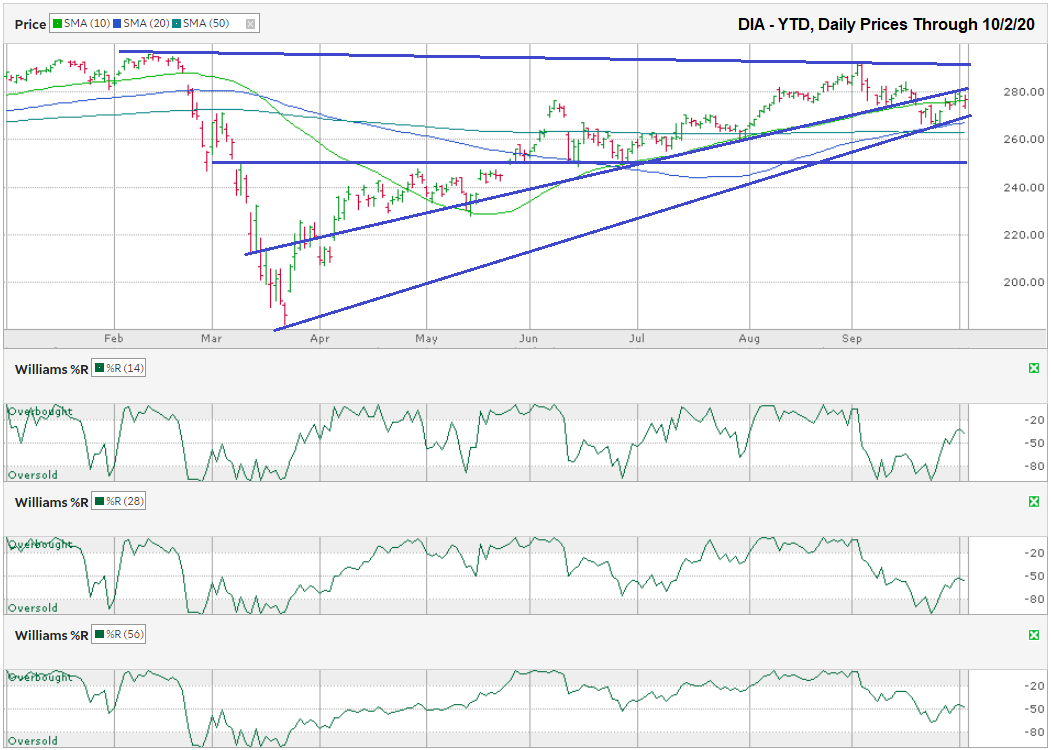
The chart below shows the daily prices for the year-to-date through October 2, 2020, for the Dow Jones Industrial Average ETF, DIA, after closing the week at $276.80.
DIA is trading more than five percent below its recent high from a month ago and 52 percent above its intraday low on March 23. The recent price drop removed some of the euphoria from the rally and caused the large-cap ETF to fall below its trend line of higher lows. Since then, this same trend line has acted as a point of resistance, limiting the range DIA can bounce off of its lows from the prior week of trading.
DIA’s 100-day moving average acted as support to stop the price decline, but might come back into play soon as DIA could not hold above its 50-day moving average on the bounce. Every day DIA continues to waiver over its 50-day moving average, the more likely it is to falter to the downside. This weak side move will allow the 100-day moving to be retested and if it fails, the 200-day moving average could be the next area of support, four percent below Friday’s close.
The Williams %R indicator showed buy signals for the 14 and 28-day periods to begin last week, but it might need to retest the lower range of DIA’s trading channel to get the 56-day indicator to sync with the momentum trend. For now, the technical indicator stalled and does not give a clear signal for the coming weeks.
DIA has been in a broad sideways trading channel since late May and is unlikely to move outside of this range until after the election results are finalized and accepted by both sides. The downside support is close to $250 and the upside resistance is approximately $290. A $40 range gives traders a lot of room to make money on the swings, but buy-and-hold investors will have to be patient before we see a breakout in either direction.


