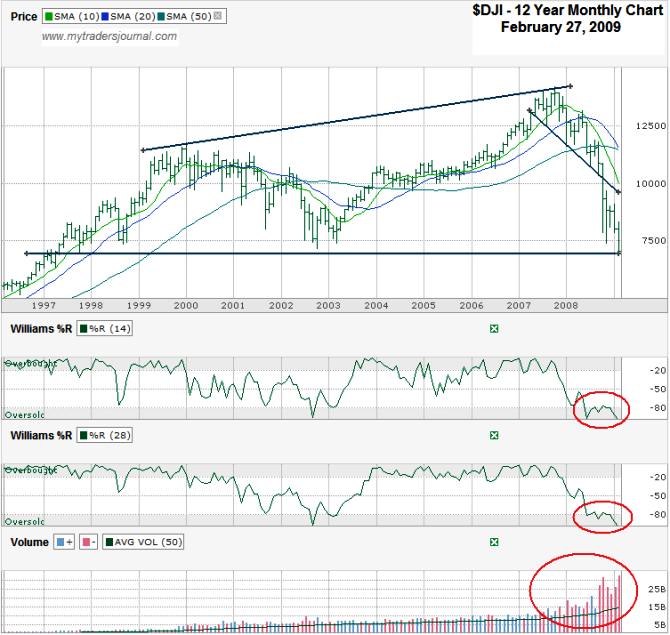
The DJIA chart below goes back 12 years and shows OHLC monthly price action. I couldn’t find any worthwhile trend lines I liked enough to draw a conclusion from yet. The past four months might be starting to act like they are in a trading channel that’s still heading south, but it’s too early to tell if that’s legit or not. February didn’t hit the high end of that range, so I didn’t bother to draw the lines for it.
The big horizontal line is the reason I had to go back more than 10 years to fit in the last time we were at these levels. This 7,000 range was approximately the point in 1997 that was a brief ceiling and then a one time floor before the $DJI moved up for a long run. I’m not sure if that’s going to mean much while other indicators aren’t doing much to look bullish yet.
The DJIA has had six straight down months all with above average volume. I’d like to find a positive month or even a few before I think we’re moving out of the bear’s woods. Williams %R is still sticking in the oversold range and could be there for a while. Remember, being oversold doesn’t mean much. It’s the move out of that area that signals a time to buy. I’ll be watching and waiting.
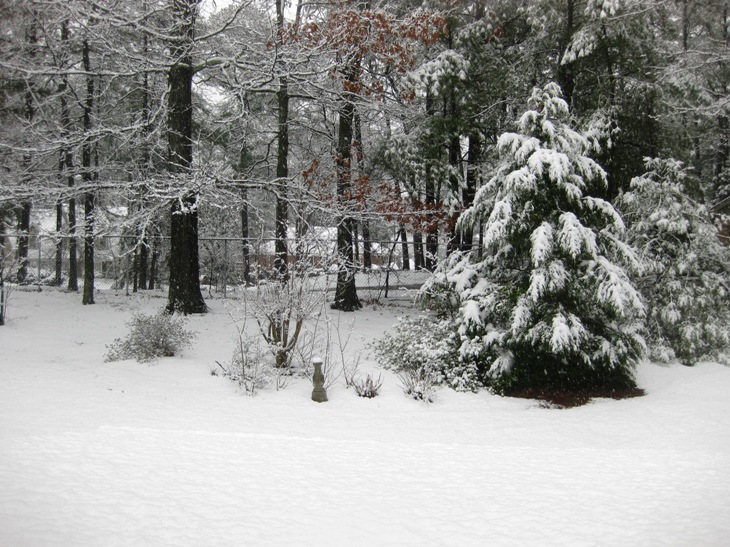
If one doesn’t think it could get worse and that odds are in our favor to have an up month now because “we’re due”, check out this picture below the DJIA chart. I took it today from my son’s window facing our backyard. It’s snowing in Atlanta, GA in March. We can go years down here without seeing snow and now in March we’re covered in the white stuff. Odds were in our favor after February that we were due to have year without snow, but that was proven wrong and now I get to go play in it with my 5 year old son. That beats watching the market tank while I’m not short stocks.


