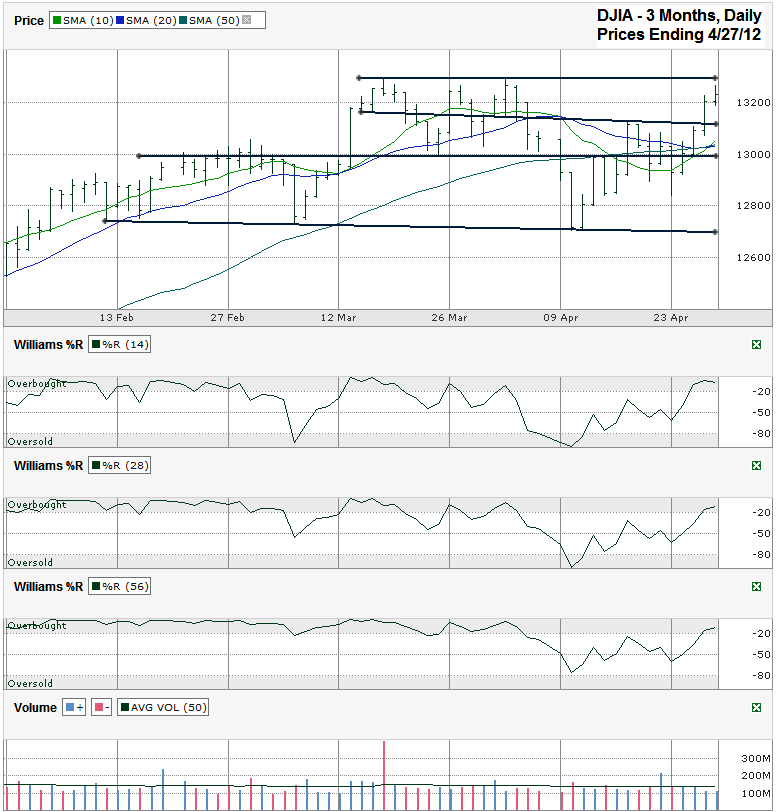
I charted the past three months of daily prices for the Dow Jones Industrial Average ($DJIA, $INDU, $DJI) after the index closed at 13,228.39 on Friday, April 27, 2012.
The DJIA hit its 2012 closing high intraday on Friday after nearly three weeks of being in rally mode. The rally cooled at that point, as is typical when an index or stock reaches its previous high. This was only a handful of points below the intraday high for 2012 too. Now it gets tricky. The large cap index is at the top of its horizontal trading range for the past couple of months after a strong rally, but technical indicators are still saying there’s more upside in this rally. The 10, 20 and 50 day moving averages (dma) all converged at the end of this past week and the momentum is clearly leaning towards the bulls. As shorter moving averages overtake longer ones it shows momentum favors higher days still ahead. This is particularly true with the 10 and 20 dma which cross each other more often. However, after such a quick pop higher, a short retracement back to the 10 dma can be fairly common. This will be another buying opportunity (if it even happens) once the moving average shows support again.
Before the moving averages caught up to the change in sentiment, the Williams %R indicator gave a good heads up that this move was coming. Both the 14 and 28 day periods hit a low of -99.08 and then popped higher as momentum quickly changed. Now, all three periods (14, 28 and 56 day) are all comfortably in the overbought range. The rally can last weeks or even months while “overbought”. Keep watching this indicator to see a change in sentiment marked by a confirmed move below overbought.
I charted the three month view because I consider the moving averages important enough right now and wanted to make sure they were visible. It’s worth noting that the six month and one year charts show the market is in the middle of its longer ascending trading channel and the bull market doesn’t have stiff resistance at the current levels. Actually, the Dow is only hitting a small speed bump on the longer charts at a line that was support and has since been occasional resistance. The top of the longest trend line of higher highs points above Dow 14,000. Oh, but it’s almost May. Should we sell and go away or is that too much of what’s expected now and therefore won’t happen?


Volatility high. I expect that upper price level to be resistance.