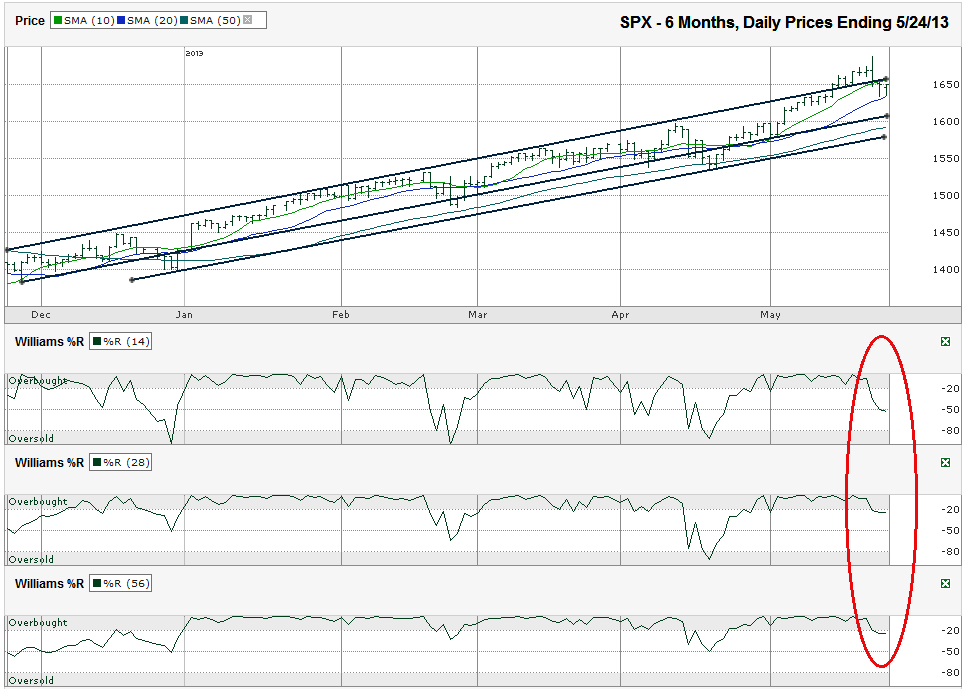
I charted the daily prices for the past six months on the S&P 500 index ($SPX) after the index closed at 1,649.60 on Friday, May 24, 2013.
The S&P 500 broke above previous resistance a couple of weeks ago. That breakout didn’t last very long. The large cap index has fallen below that trend line again. Often, a failed breakout is more bearish than a bump against resistance. The failed breakout shows the bulls made a real attempt to change the pattern and didn’t have enough strength to pull it off. This can be a signal of weaker days and weeks to come as a near-term top might be in.
That’s not going to be the case if the 20-day moving average (dma) doesn’t give up support. Last week, the 10-dma broke support for the first time in May, but the 20-dma held tough. This support helped the SPX move up close to its trend line of higher lows again. Both this specific trend line and the 20-dma are ascending, but the moving average has a steeper ascent. Watch these two lines to see which one falters first and that could determine the next 45-60 points for the SPX.
If the 20-dma breaks support, two more trend lines of higher lows are 45-60 points below it. Both of these could offer the next level of support along with the 50-dma. A dip to the lowest of these lines would equal a mini-correction of roughly 6%. That should be enough to bring in buyers from the sidelines who have missed out on the rally so far. A break below this could kick the SPX lower by another 80-100 points, until the 200-dma (not shown) comes into play.
Although the 10 and 20 dma haven’t shown a bearish crossover yet, the Williams %R indicator has thrown up a red flag already. The 14-day indicator broke support and has had two confirmation days. The 28 and 56-day indicators started to slip, but moved sideways on Friday. Watch these two timeframes to see if they fall further from the overbought range. If Tuesday and Wednesday are weak, most of the correction could be in already, but it could also be the beginning of an extended distribution period. After such a long run higher, the tipping point is harder to peg because potential support is scattered every 10-20 points along the way down. By now, caution should be raised and some profit taking is due. Reducing some exposure in small chunks on the way down will save traders from getting whipsawed too badly.


