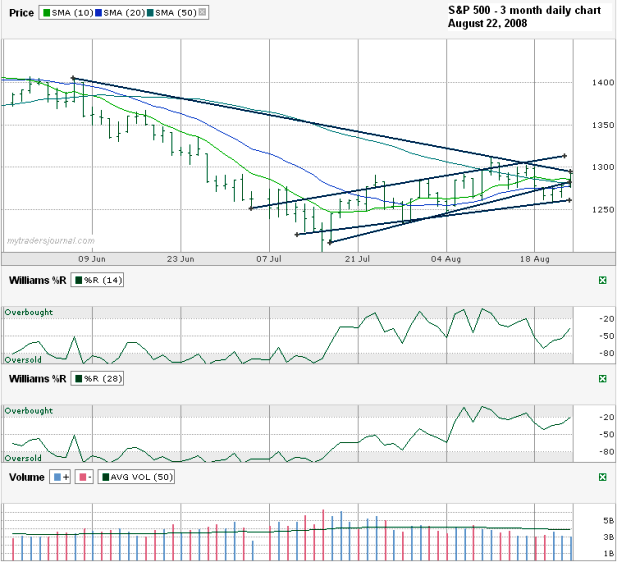
My Sunday series of index charts continues today with the S&P 500 ($SPX). This time I took a shorter view and only went back three months to see a daily view of the price changes. The SPX is getting to an interesting place in its trend line movement. The longer term downward trend of lower highs is coming to a point soon with the upward trend of higher lows. One of the trend lines of higher lows broke last week, but then recovered. The S&P 500 even rallied above the 10, 20 and 50 day moving averages for a strong finish to the week.
With the close on Friday finishing near the trend line of lower highs, I expect a (maybe brief) pullback to lower trend line of higher lows. As volatile as this market has been, I don’t expect those lines to hold more than another week. If they did, we’d have a very narrow trading range by next week and this market just doesn’t like small moves. I see it breaking, but can only guess that the move will be lower with gas prices still high. I don’t think Wall Street realizes the average worker is having a hard time paying these prices over $3.00 still. $4.00 was crazy, but $3.00+ isn’t so easy for a lot of people.
* Side note, I upgraded my WordPress version and now on old posts you’ll see “” sprinkled in among the text. I’m trying to figure out how to fix that. I’ll take suggestions.

