Last week I charted the NASDAQ Comp Index and the only words I bolded were “bearish cross over”. This is the prime reason I chart indexes, too see these macro trends which help me avoid certain sectors. The NASDAQ fell almost 5% last week immediately after its bearish cross over of its 10 and 20 day moving averages.
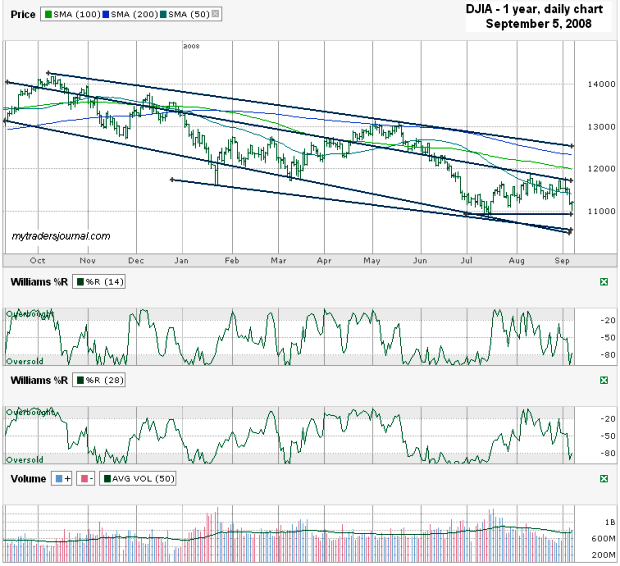
This week I’m charting the Dow Jones Industrial Average ($DJI) aka DJIA. It’s not quite as easy to pinpoint a turning point.
- The DJIA near the lows of July that held support – that’s bullish.
- The DJIA is closer to the bottom of its trading range than its top – leaves more upside than downside.
- The DJIA is below its 10, 20, 50, 100, 200 day moving averages – that’s bearish.
- The DJIA finished a bad week by bouncing off its intraday lows and closing higher for the day – that’s bullish.
The chart leaves us wondering if the downside will break to new multi-year lows or if this is a logical area of support that already has the negatives of the economy baked into the prices. The economy is bad still with oil still higher than it was six months ago and unemployment rising – that’s very bearish.
Until the DJIA can cross the 12,000 area with a few follow through days, I’m not holding my breath for a sustained rally. I want to see how next week unravels with hurricane Ike’s arrival to the US shores. Oil could spike again if Ike enters the Gulf.
[EDIT: This news is a game changer. The markets should rally with a foundation under Fannie Mae and Freddie Mac]

