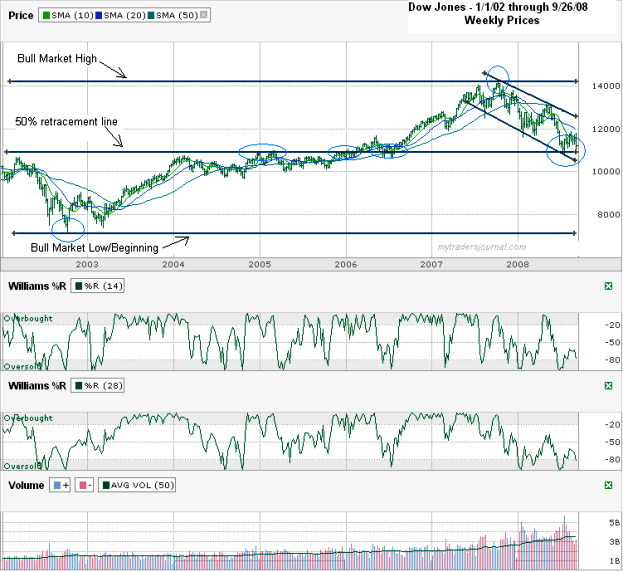
Today I charted the Dow Jones Industrial Average ($DJI) since the beginning of 2002 through this past Friday, September 26, 2008. Michael Santoli pointed out an interesting technical achievement for the Dow Jones in September 29th’s Barron’s that I thought would be interesting to look at. We’ve hit the 50% retracement level from beginning to end of the bull market and then bounced.
This is what he was referring to – If you take the high of October 2007 (14,198.10) and subtract low of October 2002 (7,197.49), divide that number in two and add it to the low you get 10,697.79. The DJI broke that level eight days ago on September 17th, with a closing price of 10,609.66. The next day it dropped a little low to 10,459.44 intraday before coming off the floor. It hasn’t broken that mystical number since then and with the bailout plan likely to be finalized soon, it might not. Could that line be all we needed to find a turning point? I’m not betting on that yet. I want to see a housing and jobs recovery first, but will take either as an excuse to buy.
Had I not been looking for the 50% retracement line, I’d have probably pointed out the areas I circled in 2005 and 2006 where today’s DJI price was last seen and seen often. I like that extra layer of support that it could offer if I dare think bullish or at least not bearish. I won’t actually turn truly bullish until we break the downward trading channel we’re working through right now. I’ve mentioned it a couple of times this month, I think the downside risk of losing money might be less than the upside risk of not making money if you don’t have your money on the table. It’s likely to remain a volatile market, so I still suggest being cautious with any trades.
To see more of my index charts from previous weeks, click here.


I think with today’s action and the continued weakness in EVERYTHING that most should remain cautious.