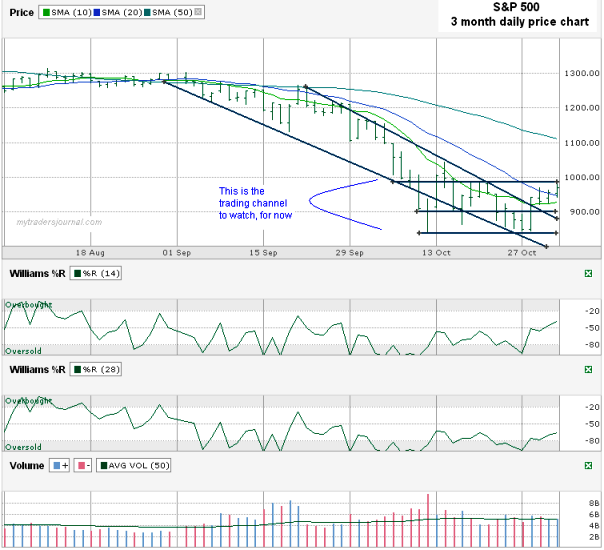
I charted the past three months for the S&P 500 ($SPX.X) today. In the November 3, 2008 Barron’s Kopin Tan mentioned that the peaks were getting lower on each bounce and that 985 and 845 could be the new trading range to follow. Any break to either side could spell the direction to chase for the following few weeks.
I disagree with Kopin on the “weaker peaks” to some extent. The way I draw the trend line of lower highs, I see that the SPX broke above that line this past week and held above it. That’s key to me to see that we closed above the down trending line for four days in a row. I do agree with him on the trading range though. For the past few weeks the S&P 500 has settled in this little nest and become quite comfortable.
The SPX also moved above the 10 day moving average last week and then used it as a floor for the next two days. During those two days, which proved confirmation of the upward swing possibly having some legs, the SPX even moved above the 20 day moving average. Then on Friday it stayed above it all day showing real strength. Without the trading range I mentioned at the top I’d think that the SPX could be at the beginning of a big run, but until it breaks above the 985 range I won’t hold my breath for this rally.

