This was the worst weeks I’ve ever felt as an investor. I came back to the Dow Jones ($DJI) Chart again this week because it’s interesting to see where it’s been and consider where it could be going based on technicals. I have a hard time thinking I know anything based on fundamentals since so little is known about what’s coming with earnings (do we ever actually know what’s coming) and how much of our decline is based on reality versus fear.
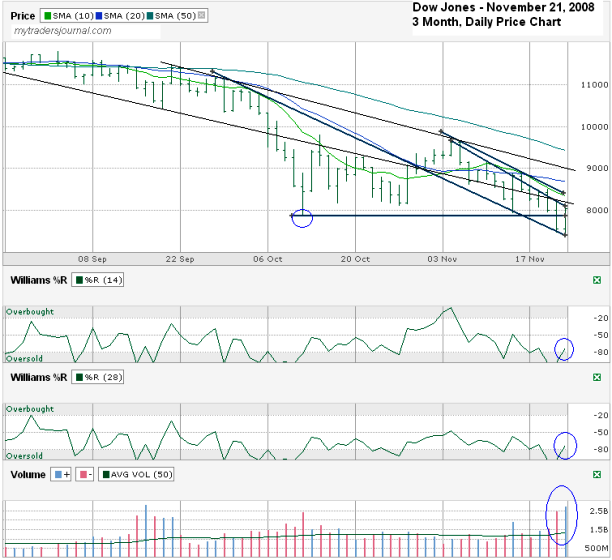
We caught a bounce off the declining trend line of lower lows, but that doesn’t mean we can’t come right back down there to hit it again. The DJIA actually dipped lower on Friday for a little while to hit that same line again before finding its footing. When I saw the bounce building on Friday I started looking back at the previous low from October 10th of 7,882 and thought it could be a ceiling. Finally, after 3:30 on Friday the DJIA broke that level to the upside, toyed with that line to the downside one more time just to make sure it was for real, caught intraday support on the 1 minute trend line of higher lows and took off again to new highs for the day.
Although Friday gave a fun rally at the end of the day, the trend line of lower highs is only a few points away, as is the 10 day moving average and another trend line that ignores some of the single days above the trend line of lower highs. The latter line is dead-on the Dow’s high of the day from Monday, Tuesday, Thursday and Friday of this week. If that line holds, the DJIA is heading down on Monday again. If that line gives way to the up side, the 20 day moving average isn’t too much farther up to act as a ceiling and the long thin black line I drew just above that shows the longer down trend line of lower highs comes crashing on us. That thin line could have been drawn in extra bold width to better illustrate the power it may hold. To me, that means sell the rally.
The bullish argument against that bear theory is that volume was up bigger on Friday, the best up-day in since September 16th. Bears might say short covering played a part of that, so don’t get comfy. Furthering the bullish argument one might point to the Williams %R indicator for the past 14 and 28 days. Both show the DJIA is pulling out of oversold. This is the time to buy according to this indicator. Looking back to Wednesday and Thursday, it’s hard to imagine that the markets wouldn’t have a good up day after %R literally dropped off the chart. At that point there’s nowhere to go but up. Still, I can’t imagine not selling a rally with all the economic woes hitting us still.
On a non-charting note – the gas station where prices made it up to $4.59 during the Atlanta Gas Shortage is now selling regular unleaded for $1.79/gallon. At some point that has to aid in the relief to consumers who were getting used to paying well over $3.00/gallon if not $4.00 on a regular basis. That might be the only glimmer of hope I see out there right now aside from the timing of a possible bounce from oversold levels.


Puh, seems it wasn’t such a good month for Dow Jones. The financial crisis is not over yet … damn, lost quite some dollars in it (ok, for me it es Euros – but still lost them)
It certainly has been jumping around a lot, admittedly not being overly knowledgeable about the market, I have been at a loss trying to even half predict where it is heading. Google has a neat service where you can invest pretend money and then track it to see how you did. I ‘invested’ $500 of fake money a few weeks ago and have lost well over a $100 so far.