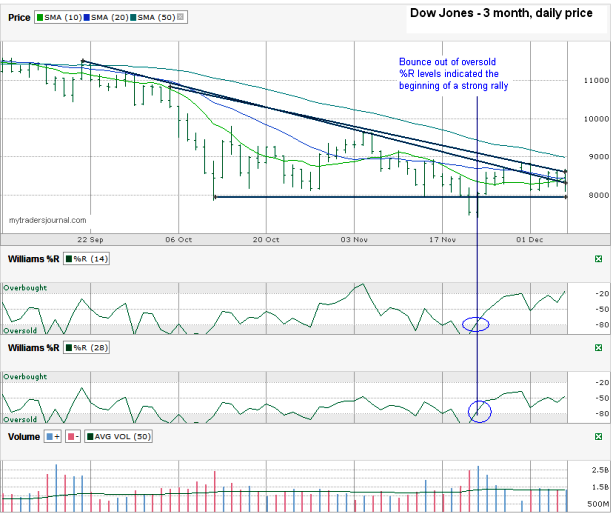
The Dow Jones Chart ($DJI) I drew ending on Friday shows two big trend lines about to meet. This means one of the trend lines will have to break and whichever side gives should lead to a decent sized move in that direction. A couple of weeks ago as part of my November 21st Dow Jones Chart I pointed out that Williams %R was breaking out of oversold. As I repeat often, this is the spot to watch, not hanging in the oversold section of the indicator, but breaking north of it. As it does most of the time when that happens, the Dow Jones Industrial Average had a nice bull run after that and gained more than 10%. As all bear market rallies, reality came back and the Dow Jones has fallen some since then, but not back to where it was then.
I only drew three trend lines this week. The bottom one was broken twice in November, but only closed below it on one day. The other two are trend lines that show the lower highs that have been acting as a ceiling for the past three months. The trend line that started first broke Thanksgiving week and then acted as support on that same day before losing it’s power the next few days. The shorter down trending line is still holding as a ceiling. That line acted as out max point a few times over the past six trading days. It’s this line and the horizontal (usual) floor that are about to intersect and give us some idea of where we might be heading for the last weeks of the year.
Last, but not least, notice that the Dow Jones broke above the 10 day and 20 day moving average since my last Dow Jones chart and now has the 50 day moving average in its reach. Crossing the 50 day isn’t going to come easy. Wait for the second or even third confirmation day above it to decide if it might be for real.

