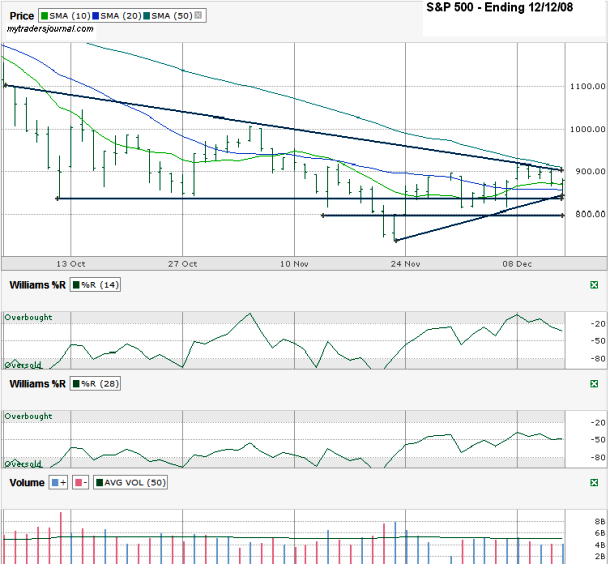
The S&P 500 (SPX.X) chart ending December 12, 2008 shows similar price action as I predicted in my Dow Jones Chart last week. The challenge the Dow Jones faced last week and what proved to be its ceiling and the S&P 500’s ceiling this week was the 50 day moving average. After climbing above the 10 and 20 day moving averages both indexes had the 50 day moving average as the next hurdle and didn’t quite seem able to make it over without tripping.
I drew a few trend lines that might offer the next areas of battle. The down trending line that started two and half months ago held for four days last week before winning the one week battle. That brought the next trend line in play, the up trending line that started in late November. It has hit a couple of times and held support, just as it did on Friday. Just below that as a second line of defense was the horizontal trend line that started in the middle of October. It’s not as definite, but seemed to prove worthy when pared with the other line I just mentioned. Below that and much more important possibly, is the 800 line. Big round numbers can play a roll, even if not exact. That’s the area that must hold to keep this longer trading channel in play for a while to come.
Williams %R for the past 14 days broke below overbought and that’s typically a bearish signal. The only saving grace might be that the 28 day %R never even made it to overbought, so this isn’t quite conclusive yet. Volume doesn’t offer us much either. We haven’t broken the average volume in a couple of weeks, so we get no real indication of where the big money wants to take us.

