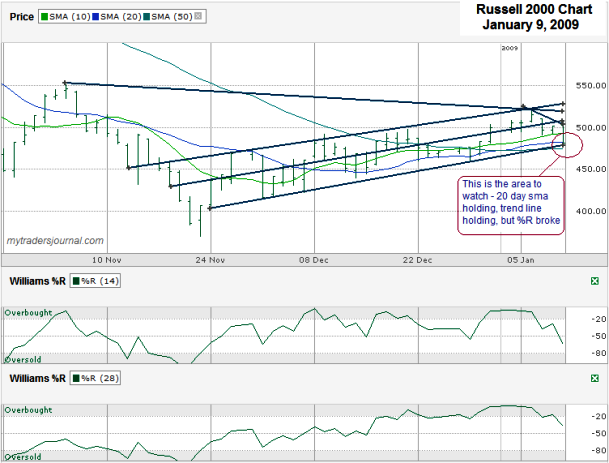
It’s been a long time since I charted the Russell 2000 Index ($RUT.X) and I think I picked a good time for to check out the benchmark for the small-cap stocks this weekend. I circled the last day of the past (nearly) three month chart. It might be we were lucky the bell rang when it did on Friday because the RUT closed within 2 points of its low of the day and for the year to date too. The good news is that the trend line of higher lows and the the 20 day simple moving average, which seems to hold some weight on highs and lows, were in sync on Friday and held support when the future looked dim. Because in this market all indicators don’t seem to look rosy at the same time we find the Williams %R indicator shows that RUT has broken out of overbought. That tends to be a bearish indicator and makes me feel nervous about the strength of the first two indicators which are bullish.
If we were in the middle of a strong bull market I’d be happy having two of three indicators pointing positive, but these days I have to think you should stay nimble and wait until you can see if these two meeting lines, the 20 day sma and the trend line have some staying power. If these lines hold, I’d like to see if the trend line (that might nothing) that has started to form over the past four days break. After that the upside, which I don’t see breaking for a while, is closer to 525, well above the current 481 level. To trade the Russell 2000 you could consider the iShares Trust Russell 2000 Index Fund (IWM). It’s optionable and has high enough trading volume to keep it fairly liquid. If you want to triple your risk/reward potential, Direxion Shares offers some 3x ETFs to work your trades – the bullish tilted ETF is TNA and the bearish tilted ETF is TZA. I’m not touching them, but thought some of you might like the extra choices. The volume is a lot lower on both of these, but if you pick the right side you could get a good return. Definitely use limit orders when trying to trade in or out of these. The lower volume can create larger spreads between the bid and ask prices.

