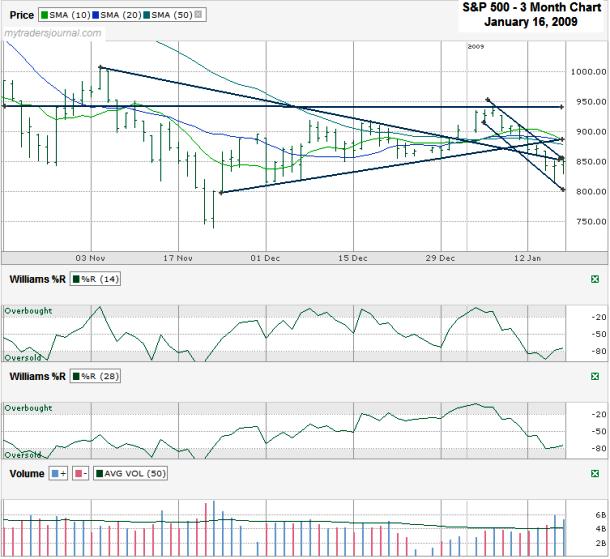
The last time I charted the S&P 500 (SPX.X) I drew a trend line of lower highs. That line broke to the upside and the SPX got above 900 for just over a week. Then the Williams %R indicator broke below the overbought area and the SPX unwound. For those not still lost in New Year’s celebrations this was the red flag to step out back for a little while. The S&P 500 fell below its 10, 20 and 50 day moving averages following a fairly tight trading channel down to within a couple of points of the lows it touched the first week of December for a few days. That level has held support so far.
The next big question to be answered within days for the S&P 500 is if that same 815/817 line (Thursday’s low) will hold or if the tight trading channel will break to the upside. The bulls will point out that Williams %R seems to be edging out of oversold, at least on the 14 day indicator. There’s potential the inauguration will give stocks a short lift too. Also, we’re still so far below the 100 and 200 day moving averages (not shown on this chart) that a slight reversion to the mean could offer a solid rally that lasts more than a few weeks. In the very short term, the SPX might even try to catch back up to test its 10, 20 and 50 day moving averages. All of those chances for something positive could add up for a pleasant week for the broader markets. If the tight trading channel I drew stays intact, I expect 750 to hold strong support and offer a great entry point for those still nervous. In other words, I think the upside potential outweighs the downside risk right now.
Last week in the Russell 2000 chart commentary I noted that we were only saved by the bell at the end of the week. Too bad for RUT.X investors that the bell on Monday morning meant the trend continued. The trend line of higher lows broke and now is acting like a ceiling. Coupled with that, the 20 and 50 day moving averages broke support and provide another hurdle for the RUT.X to deal with.

