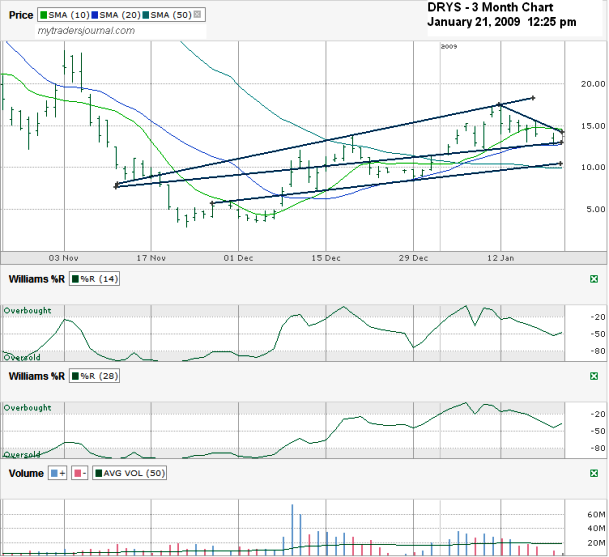
I’m still long 1200 shares of DRYS (DryShips Inc) including the six June 2.50 calls I own. I’ve sold three February 17.50 calls on DRYS and I’m debating more. Part of my analysis always includes a chart. So, here’s the DRYS chart as of around 12:25 pm today. What I see is that DRYS is hugging one trend line for support and could fall closer to $10.00 if this current line breaks. Along with the $10 range trend line of higher lows the 50 day moving average is close by and offering another line of support to the downside. The upside is being hindered by a short trend line of lower highs that started at the beginning of last week when Williams %R broke below overbought . Had I charted DRYS then I would have sold new calls then. Apparently I was sleeping at the wheel.
That line is forming a triangle with the first line I referenced which will likely move in a large move in either direction. I see that direction with least resistance being up. The top trend line of higher highs will be near $20.00 soon. I see that upper trend line as hard one to get past for a while, so new covered calls near there might be a good trade. Also worth watching are the 10 and 20 day moving averages where DRYS is stuck between this week. Which way DRYS breaks free from those to moving averages could be telling for what it will do for the following week or two.
The trick will be to figure out the best time to sell these calls. Since I think DRYS has some more upside potential to recover, I’m waiting. I’ll go ahead and put a limit order in to hit in case we get a good bump in the near term and I’m not watching closely enough.

