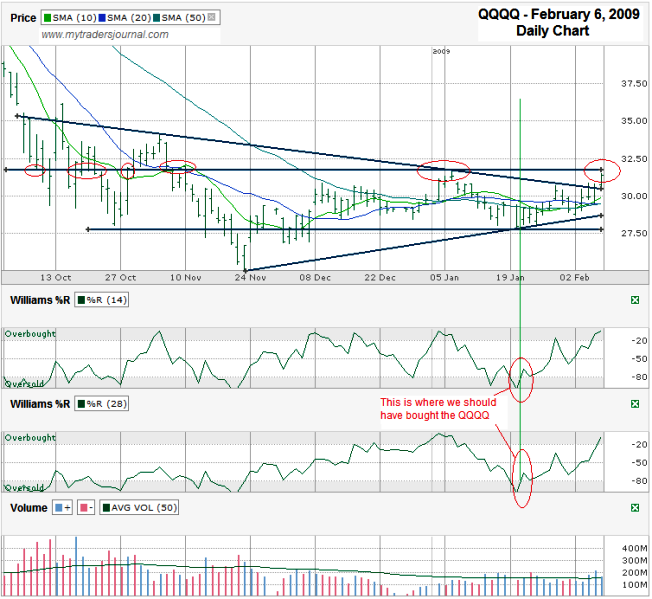
Like last week, I’m charting a tradable ETF (QQQQ) instead of the index itself. QQQQ is designed to correspond to the NASDAQ 100 index. This chart runs from October 1st through this past Friday, February 6th. I highlighted a few points on this chart below worth discussing.
- The green vertical line shows where Williams %R broke out of oversold indicating a buying opportunity.
- The horizontal trend lines show the trading channel the QQQQ has been stuck between for the past few months. We’re at the top now as is highlighted by the red circles. That top line shows the meaningful resistance on the way down in October and the way up ever attempt since then.
- The leaning trend lines tell interesting stories. The lower one which tracks the trend of higher lows could offer support in a pull back from this recent rally. The upper one tracks the trend line of lower highs. The trick with this one is that it just broke, but only for one day so far. We need a follow through for a couple of days to give it real credibility. If it can stay up then it can become a line of support rather than a line of resistance. It won’t be long before the former line catches up to offer more help for support too.
With conflicting indicators we find it hard to lock down a hard opinion of near term direction. I won’t consider a bullish trade until I see a strong break above this $31.50/$32.00 point of resistance that has been so powerful for months. Also, we haven’t seen the QQQQ hang out in the overbought %R range for long periods of time. I’m expecting a break south of it which would be a selling opportunity. All of that can change if the tilted trend lines take control. If they do we’ll have to trade carefully and as Steve Sears in this weekend’s Barron’s said, “Until the direction is clear, think bullish and act bearish.”

