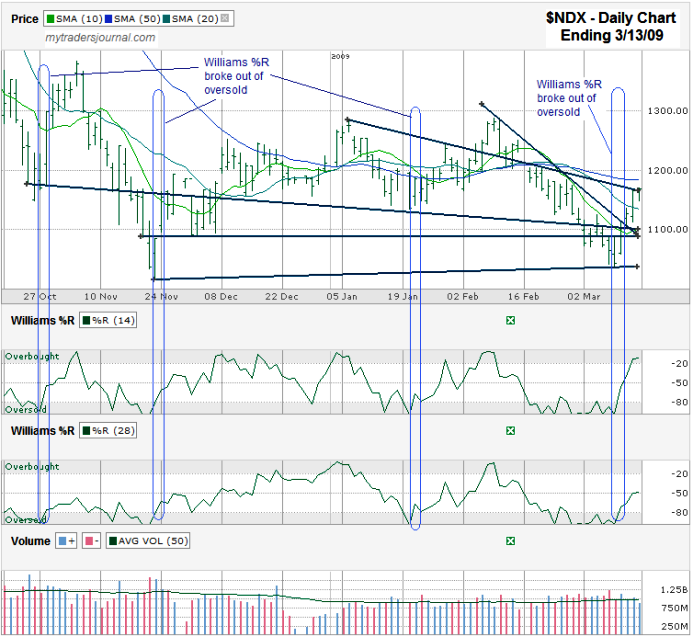
The NASDAQ 100 Chart I drew below is showing signs of life. I charted $NDX, but will trade QQQQ options if I can get the premium I want. This $NDX chart highlights two important points to consider. The first point is the Williams %R indicator and the second point is the trend lines.
I circled the past four times both the 14 and 28 day periods for Williams %R broke out of oversold. Each time the $NDX went on to have a strong run. Some of these were very short. Only one was for more than a month. The point with this is if Williams %R is correct again for this fourth time since late October, now is the time to have a short term horizon trade again. With QQQQ closed on Friday at $28.74 a vertical put spread could work where you sell QQQQ April 30 puts and buy April QQQQ 28 puts as a hedge. With this trade you risk $1.00 to make $1.00. You break even if QQQQ ends expiration at $29.00 or above, not counting commissions.
I drew five trend lines on the chart too.
- The most important one to me is the bottom one. The NASDAQ 100 Index did not break below the November low like the Dow Jones and S&P 500 did. That could mean that $NDX might be a safer trade than most other indexes.
- Moving up to the horizontal trend line you can see $NDX did drop below other lines of support, but recovered fairly quickly, i.e. it’s not infallible.
- The longest trend line I drew cuts through a few areas that didn’t hold true, but seems to be a speed bump on $NDX’s way to new highs and lows and sometimes acts as support.
- The trend line starting at the beginning of January broke briefly in the first half of February and then acted as resistance in the second half of last month and again Thursday and Friday. If we break that line to the north, it could be a new line of support, although at lower lows for a few days or weeks.
- The shortest trend line is the steepest. It shows the trend of lower highs from a month ago through Tuesday of this past week. Breaking that trend line is another bullish sign that I wish I had noticed on Wednesday to have traded on it then.
Whether or not all of this adds up to any more than a bear market rally is debatable. I suggest being careful with getting too bullish, especially the longer this upward trend lasts. I suspect we’ll get some more deeply down days before we can claim to be back riding the bull again.

