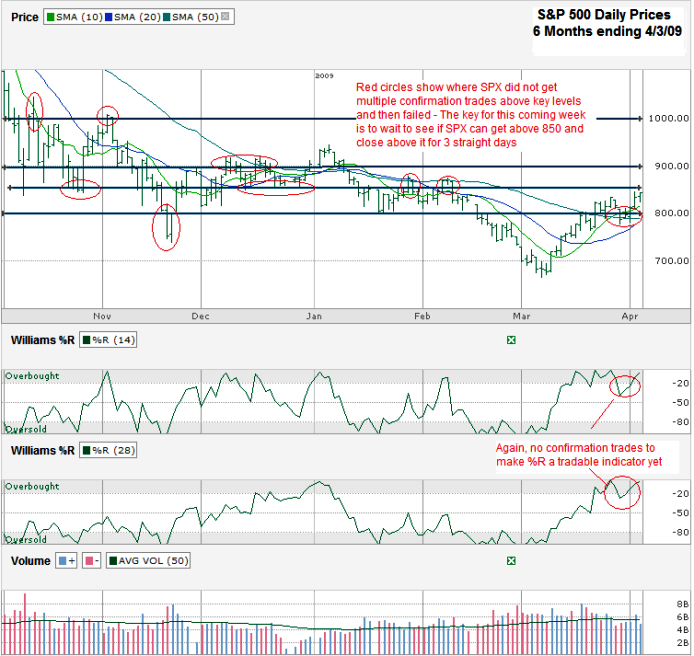
The last time I charted the S&P 500 ($SPX.X) I was confident enough that it was going up that I even said it was a buy in the title. Today I’m not as confident. The big technical indicator that drew my attention last time was that Williams %R broke above oversold and confirmed that direction for three days in a row. It did it on both the 14 day and the 28 day indicators and it was clear we were starting a big run. I’ll admit I didn’t expect to get four straight weeks out of it, but we did and this run could go longer, maybe. Before committing to the belief that this rally’s legs still have stamina remaining I want to see multiple closing above 850.
I thought last week was going to be the beginning of another dip (or bigger fall) when Williams %R broke from overbought, but the 28 day indicator didn’t get a follow-through day and by the third day even the 14 day indicator recovered to show strength. Take a look back to the chart I hyperlinked to above and you’ll see the difference in how strength in %R played out. That’s why I always talk about finding those confirmation days in the charts when an indicator suggests a directional change. You can miss a few directional percentages by waiting, but you can save a lot more in losses when the wait pays off, like this time.
800, 850, 900, 1,000 – those are some the round numbers that have ended up playing a roll for the SPX over the past six months. Clearly there’s a psychological influence there and it’s not just coincidence that round numbers are where the SPX paused for support or resistance. Instead of fighting the logic in this I have found it more profitable to use these areas as points to watch and wait for my better/safer entry points.
The red circles in my S&P 500 chart below show where SPX did not get multiple confirmation trades above key levels and then failed – The key for this coming week is to wait to see if SPX can get above 850 and close above it for 3 straight days. You can see in December how the 850 line was the major line of support for more than two weeks of trading. In late January and early February SPX made two attempts above 850. On the first attempt it only closed above 850 once and on the second it made it twice, but failed miserably on the third day. Support can often become resistance once it’s broken and vice versa and that’s why I’m waiting to call next week a continued bull run. Along the same thought, 800 could be the new support nearby on the down side.


The S&Y has just made another higher low today. Who knows how long this will last, but if it continues it could be a good sign.
Oh yeah, and there is a potential head and shoulders pattern forming, very interesting.