I posted a Dow Jones chart last week and pointed out the line of demarcation looked like 8,150 to me. On Thursday and Friday the Dow was able to climb above that mark intraday, but on both days it failed to stay above it. The Dow finished its sixth straight week of gains and now looks poised to retreat after failing to stay above 8,150. The Russell 2000 ($RUT) chart tells a different story.
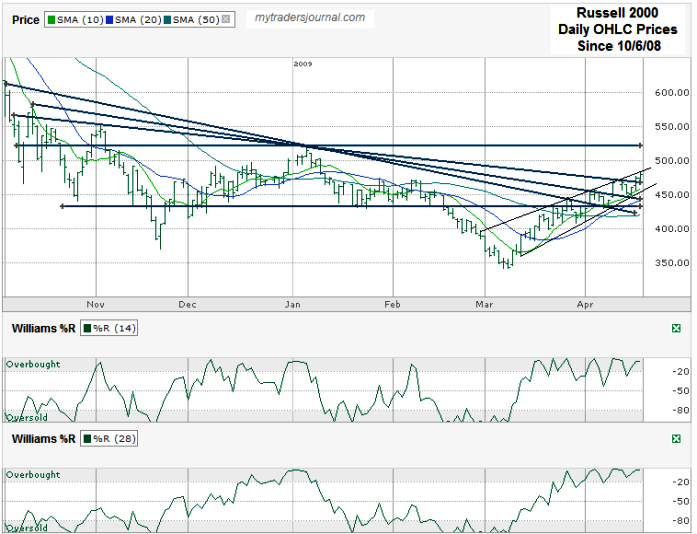
I charted RUT after it closed at 479.37 on Friday April 17, 2009. I used the January 6, 2009 intraday high of 519 as a key point of four of my trend lines. That was the high of the bear market rally that ended at the beginning of this year.
- The first three lines worth watching are the trend lines of lower highs. Starting with October 6, 2008, the point where the Russell 2000 took a steep one day loss that pushed it over the edge, I passed through the January mark and hit a point near 450. That trend line acted as resistance for a few day and then broke only to be used for support a few day later.
- The next steepest line started six days later and after using the January mark as another point of reference acted as resistance a little above 450 and then as the first line used it as support.
- The third line of lower highs started in between the first two and ran the same pattern, resistance just below 470, then support and that’s where RUT is now.
- The fourth line I drew uses January 6th as the horizontal line that could be a real hindrance to pass. It’s the psychological mark where anyone who got in around then will likely consider selling and getting out at a break even point. Chart watchers will be watching this point and waiting to see what happens with the bears ready to pour it on if they can keep the line from breaking resistance. If that line breaks, and we get two or three good closes above it, 519 could then become support as the first three lines did.
I also drew three other trend lines worth watching. The lower horizontal line is around 430+- and shows what could be support to the downside. The two thin ones that go back closer to the beginning of March show the current trading channel for the Russell 2000. Those lines are narrowing and are destined to meet in the next two weeks. Of course they won’t get that far before one side breaks support or resistance. For shorter term trading goals, those lines are going to be the ones to watch. I’d also like to see another could of days of support on line 3 above. RUT closed above it once and has held support on it once. Monday is the day after April options expiration and should be an interesting one to watch with some key indicators in play.
Lastly, Williams %R for the Russell 2000 is still in overbought and until it breaks below it for a few days on the 14 day indicator and a couple of days on the 28 day indicator I won’t expect any dips down to be more than just a shallow dip.
Want stock charts through the week? Visit Chart-Analysis.com for regular updates.


Overbought but could still move higher, In my opinion.