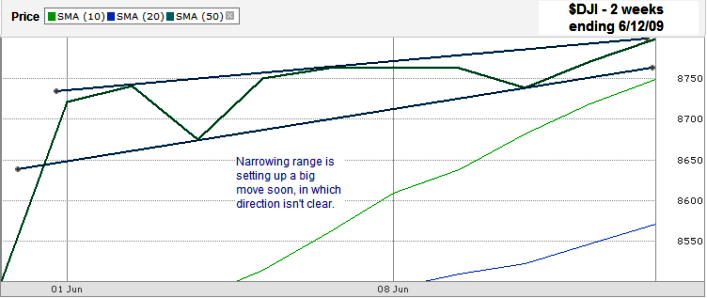
I’m posting two DJIA ($DJI) charts this weekend after the Dow closed at 8,799.26 on Friday. The top one is a look at the past 11 trading days. I typically chart using OHLC charts that show the highs and lows of the day, but thought a view of just the closing prices (the line chart) was worth the time. I think most of us have noticed the narrow range closes recently. The DJIA hasn’t closed up or down more than 1% this month. That’s a huge change from the volatility we were seeing for the past year plus. What’s more interesting to me is that the range is narrowing. These trend lines of higher closing lows and higher closing highs won’t make it to a full convergence before one side gives. I expect when one side does break we’ll see a big move in that direction for weeks following it. Don’t be fooled by the intraday moves as much as the closing prices. That’s where it might matter more for now.
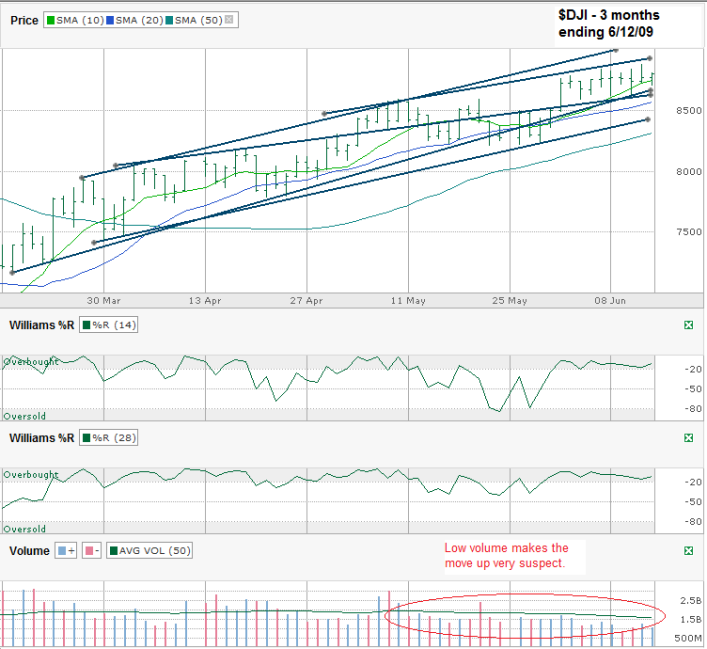
The second chart I drew is more of my typical chart style. I like to follow the intraday price movements in an attempt to figure out the direction of the following days’ closing prices. This OHLC chart has a few interesting points worth watching. Volume remains low which makes the current rally feel less credible, although anyone who has taken a profit up here feels it’s very credible. I’m talking longer term though, for those trying to pick entry and exit points. Williams %R remains overbought which tells me that momentum continues and so could the rally. The 10 day moving average broke twice last week intraday, but managed to finish the day above the line. The 20 and 50 day moving averages continue to look like they could act as support if called upon. The trend lines I drew are all still holding support showing a steady trading channel.
So, volume goes to the bears. Williams %R goes to the bulls. Moving averages are somewhat mixed, but lean towards the bulls. The trend lines go to the bulls still. Based on these four technical indicators, the bulls are leading still, but based on the two week chart above the smarter move could be to wait a few more days before opening a new position or even closing an existing one. With next week being options expiration for June, the intraday and closing price movement should get very interesting. This should be a fun week to be watching.


I agree that the range is narrowing but am still bullish until I see break lower below resistance.