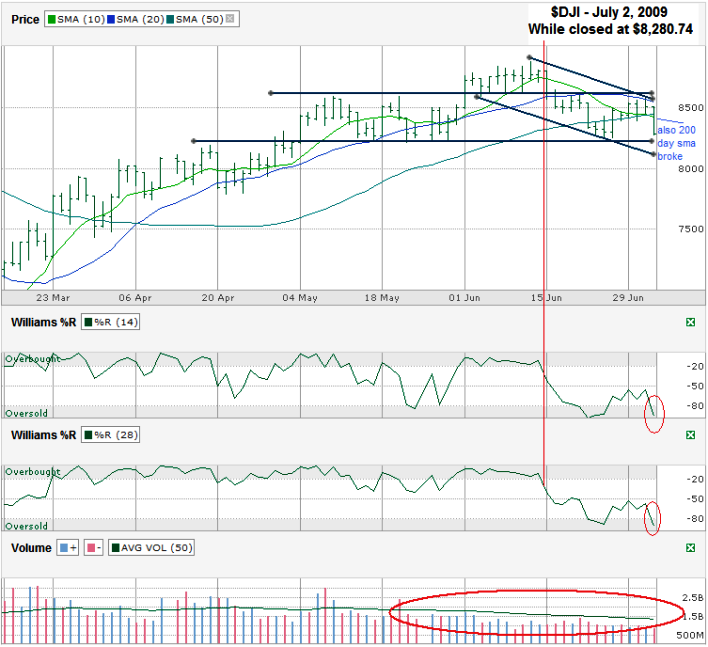
I charted the Dow Jones Industrial Average ($DJI) after it closed on July 2, 2009 at 8,280.74.

The moving averages tell the story most clearly maybe. The DJIA is trading below its 10, 20, 50 and 200 day moving averages. (The 200 sma didn’t fit on my chart, so I penciled it in blue above.) For the move upward to continue on Friday support had to hold at the 10, 50 and 20 day moving averages, but once those broke, the technicians saw it was time to jump ship and that helped the Dow dive deeper on Thursday, July 2nd. I drew two trading channels that are still intact. One is sideways and the other is pointing lower. Both could keep from breaking for days to come, but they are worth watching. If the horizontal trend line breaks, we could see the longer downtrend solidify.
The time to get out was after the Williams %R broke and continued to show decline, but the time to get back in isn’t clear yet. %R can remain in oversold for a long time, so I’m really waiting for it to break back out of the oversold range to be convinced this rally will continue. As expected, volume was low these past few days due to the short trading week and the holiday, but if you look through the long area I circled you can see volume has been below average since May.
I’m going to continue to keep cash handy and not stay fully invested for now. If we find support on the moving averages again soon and also move out of these trading channels I’ll feel safer. It seems for one to happen the other will come along for the ride, so continue to watch the trend lines and the moving averages for a better prediction of what’s to come.

Going into earnings season this week I would have liked to see some belief in the markets but they fell lower instead.
Um…The Dow Jones averages aren’t in dollars, they are points.
Good catch – typo from habit of charting stocks and ETFs on my other blog – http://chart-analysis.com