I’ve been watching IWM more than IWN for the past year, but one of my clients was blocked out of IWM due to the wash rule and that made me look for another small cap ETF for exposure for him. I like the low expense ratios and good liquidity in most iShares ETFs, so I went back there and found IWN which is the iShares Russell 2000 Value Index. The beta is about the same for these two, but IWN has a lower P/E ratio and a better dividend yield too. Their performance history is close to equal each other. Depending on which time frame you look at they alternate lead. That part ends up being a wash without a clear winner. With IWN trading at a slightly lower price I don’t have to risk as much money.
On Friday I tried to sell November 57 naked puts, but my order didn’t hit. When I looked at it this morning I decided the risk of targeting a strike one dollar higher wasn’t bad. So, while IWN was trading at $61.90 I sold two IWN November 58 naked puts at $1.30 each and received $258.57 after commissions. This moves me deeper into potential margin, but with each day the market goes up (or even stays sideways) the more likely I am to have some of my covered calls exercised and more naked puts not assigned. IWN would have to fall more than 8% for me to lose money on this trade. While it’s quite possible to see a drop like that, I think the probability of it happening in the next seven weeks left on this contract is fairly low. If it does, I wouldn’t mind buying it in this range.
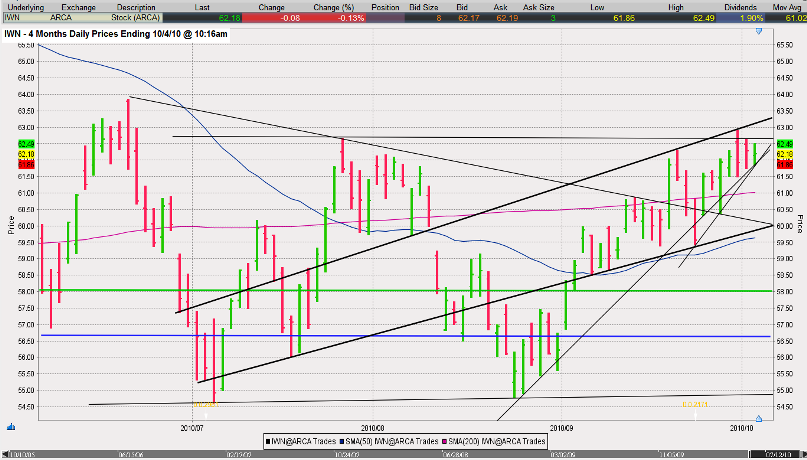
When I drew this IWN chart I included a green horizontal line where my strike is. Everything on or above that line will mean a full profit for me. Anything below that green line down to the blue horizontal line will mean I take a partial profit. A close at November expiration below the blue line (again, more than 8% below the current trading price) will give me a loss on paper. The thin black line at the bottom is where I think the floor should be to offer strong support if we see a big sell off in the near term. The thin horizontal black line I drew just above the current trading price could be an area of resistance in the near term which could mean that I didn’t time this trade very well. That line broke intraday last week, but then faltered and acted as resistance again the next day. It’s worth paying attention to. I also drew in two thicker black lines that could be a trading channel IWN will stay in for a while. It gives decent room on either side for it to trade up and down and sideways. If the trend lines don’t work for me I left the 50 and 200 day moving averages in the chart to show other hurdles IWN would have to get over to turn this into a losing trade. Both moving averages look like they have played a role in support and resistance a few times in the past four months. I’m expecting this to happen again which will leave me with a full profit. I probably would’ve gone for a higher strike for better premium intake if I had cash available to back this trade, but as a true naked put I’d be on margin if assigned and don’t see the reason to take on extra risk when I’m poised to make more than 16% annualized return based on the premiums I received and the cost if assigned.


I much prefer the liquidity of IWM and probably would have waited until the wash cleared.
Good to hear from you Mule. I agree the liquidity is greater for IWM, but to be seven weeks out and have 350 contracts trading out of the money isn’t too bad to me. It might not matter anyway since I think the floor is close by underneath my strike I’ll probably not try to roll the put and just take the assignment. If I was moving bigger lots I’d probably be more concerned, but with just a few at a time I don’t see a big risk with it.
I’m assuming you saw that if I had waited an hour or two I could’ve done $0.20 better per contract. Spilled milk…