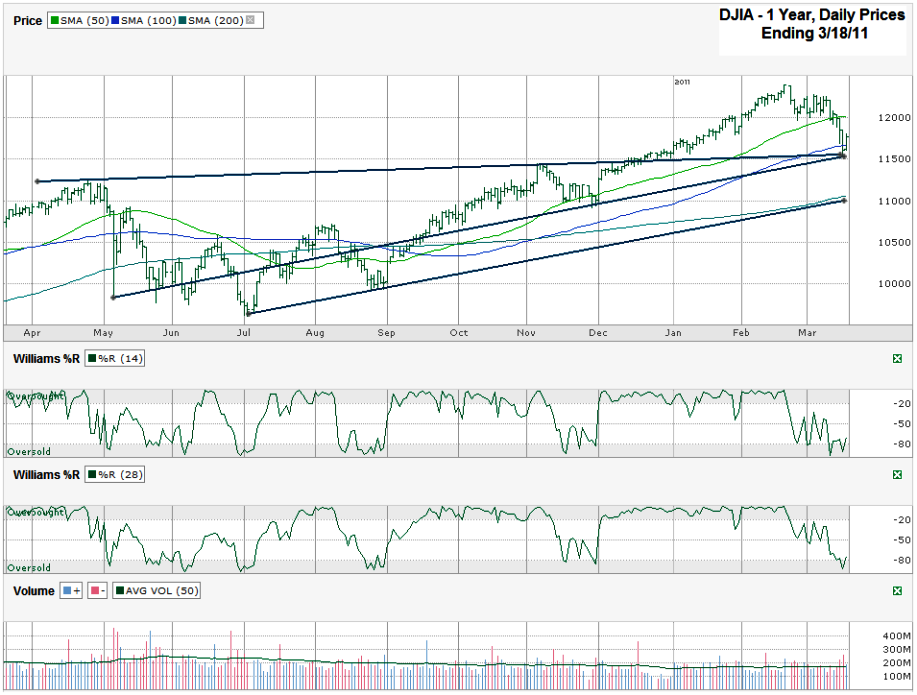
I charted daily prices for the past year on the Dow Jones Industrial Average ($DJIA, $INDU, $DJI) after it closed on Friday, March 18, 2011 at 11,858.52.
A couple of weeks ago when I posted a Dow Jones Chart I said we were due for a little bit of a correction, probably not even 10%. We got 7% before the buyers came rushing off the sidelines and pulled the Dow up a few hundred points. The question remains though, is that the end of the mini-correction? Japan’s nuclear plants are far from being in the clear, Ghadhafi/Libya is still picking up steam, oil is rising again and that’s just the big three headlines. Employment is improving though and that could be all we need to return to higher levels for stocks.
When I wrote about the DJIA two weeks ago we were just above the 50 day moving average (dma) and I targeted it as a key level to watch. Once it broke we had an unencumbered path down to the 100 dma which I also targeted as a key level of potential support, not just because of the moving average, but also because of the trend line that cut across to that same area. This ended up being the demarcation line for the bulls, although slightly below the 100 dma. We still don’t know if this is more than a dead cat bounce though. The DJIA is still down more than 4% from its intraday high and 7% above the 200 dma. That’s not exactly in the middle, but makes the path of least resistance less clear than two weeks ago.
I didn’t include the 10 and 20 dma lines in this weekend’s chart, but can report they haven’t started to draw in closer yet. That’ll be another key indicator for me to watch to see when the 10 dma moves back above the 20 dma. Waiting for these two to cross over again before reloading on stocks will give us a tad bit more certainty about the chances of the bounce to last, but will also cause us to miss the first few percent of the run back up. It’s basic risk and reward working again.
The same wait and see approach with the Williams %R indicator could save us some losses if the bounce doesn’t last, but could cost of a few percent if it does. Williams %R has come off of its very bottom levels, but still hasn’t reached above the oversold level with any real confidence yet. As I say all the time, I like two to three days of confirmation before I like to accept the move higher as sustainable.
To the upside, watch the 50 dma as resistance on the way back up. It took so long for the line to break to the downside it could play a stubborn line to cross back over in the other direction. Selling out-of-the-money puts seem to be the safest way to enter this market for now, but then again that’s almost always my stance.

