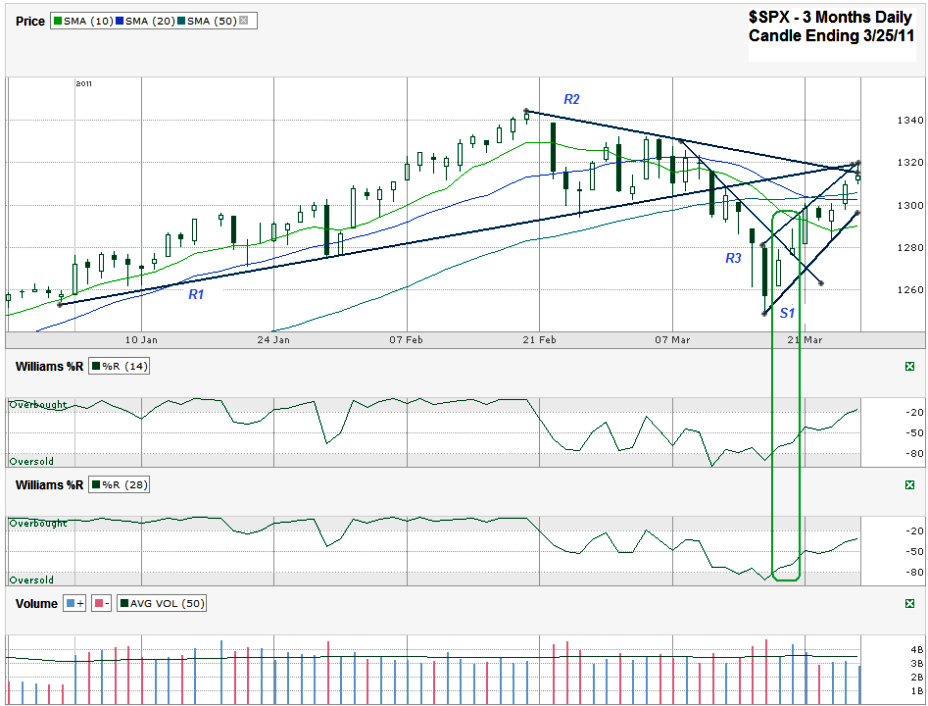
I charted the S&P 500 ($SPX) after it closed for the week on Friday, March 25, 2011 at 1,313.80.
After getting a 7% correction the “Risk-On” trade quickly came back into fashion recently. Now that we’ve had more than a dead cat bounce, what’s next? The SPX is still 21 points from its high from over a month ago which leaves some good room to run higher still before it faces the task of reaching new 2011 highs. This past week saw the index reclaim higher ground over its 10, 20 and 50 day moving averages (dma) with only a slight pause in the middle of the ascent at the 50 dma to make sure it was on firm enough footing. This move enabled the 10 dma to turn upward again, flattened out the 20 dma and kept the 50 dma from ever turning lower. Now all three of these moving averages may offer potential support on a move towards retesting any recent lows. It also sets up another bullish crossover of the 10 dma over the 20 dma, but that still looks more than a few days away.
I drew four trend lines worth paying attention to. R is for resistance and S is for support (I know, brilliant). R1 shows a line that was support for most of the past three months, but now could be a line of resistance. It held on Friday, but that’s just a single day so far. I’d be quite content to see a longer term ascent with a slope of this angle. R2 is the line of resistance marking lower highs since the 2011 intraday high was kissed last month. It actually broke intraday on Friday, but then came back to close as resistance. The cracks are starting to show in R2, but it’s still there. R3 is the shortest line of resistance. It’s coupled with S1 to show the trading channel of the past eight trading sessions. It might really be the one to watch for upside potential. S1 is just as young as R3 and should be interesting to follow too. A retest of this line in the next couple of days would allow a retest close to the nice round 1,300 level and the 20 and 50 dma lines. If that holds on such a tiny dip we could be facing new highs very soon.
The Williams %R technical indicator is siding with the bulls too. I circled the area in the %R indicator that shows where the bullish move is made along with confirmation days to show it’s for real. Volume even jumped in for a couple of days there to show its approval of the return of risk. Later in the week volume subsided and might be setting up the return towards 1,300 to let more investors buy on the dip. The attitude in the markets seems to be closer to “I don’t want to be left behind” than it is to “I’m nervous about what’s behind door number three”. As long as that mentality sticks around the news doesn’t matter as much as the fear of missing gains.

