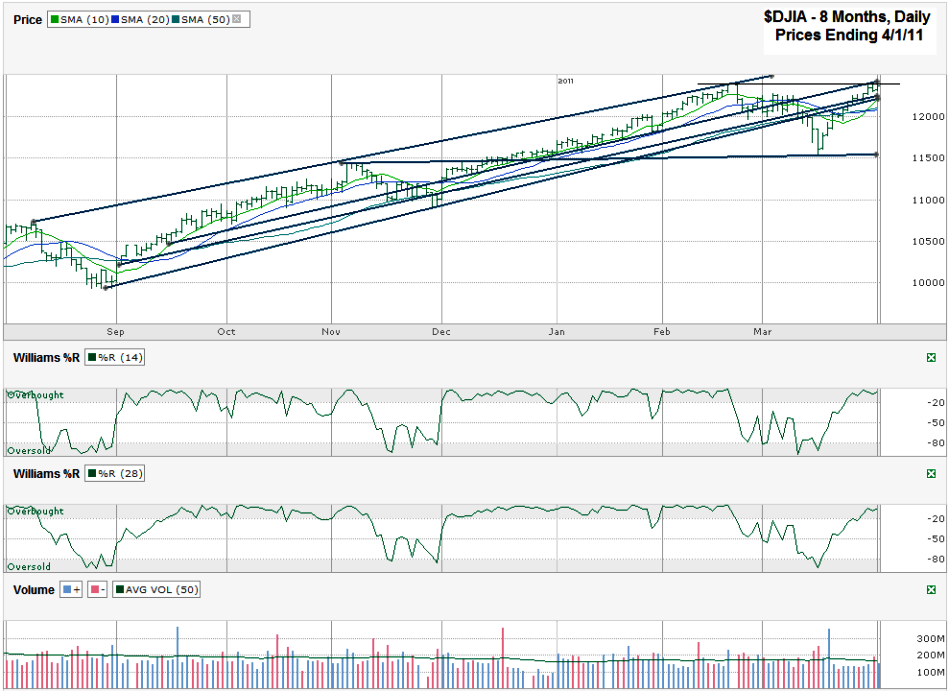
I charted daily prices for the past eight months on the Dow Jones Industrial Average ($DJIA, $INDU, $DJI) after it closed on Friday, April 1, 2011 at 12,376.72.
When I posted a chart two weeks ago I questioned whether or not the turn higher was just a dead cat bounce or not. It turns out that it looks like a real return to rally mode. Not only did the 1,150 area hold support, now the DJIA is above its 10, 20 and 50 day moving average (dma). The 100 dma (not shown below) broke for parts of a couple of days and then the DJIA moved back north again. This makes the 100 dma worth keeping an eye on again as does the 1,150 line. With the move above the moving averages we were able to see the bullish crossover of the 10 dma over the 20 dma. This is a major bullish sign for me, just as the reverse crossover was bearish.
The trend lines are getting crowded around Friday’s close. I drew two lines of higher lows that were long time support and then looked like they might be resistance. Both of these lines couldn’t hold back the DJIA’s advance higher. Now they both look to be support again. I drew another long term line of support (that has broken a few times) that is still holding resistance. This one might end up holding a little longer still since it’s coupled with the horizontal line I drew that marks the February high. The Dow broke above this line intraday on Friday, but fell below it by the close. The crack in this ceiling could be enough to open the door for new highs soon, but is worth paying attention to for a possible point to pause and catch our breath again.
The Williams %R indicator doesn’t show any signs of weakening yet. This technical indicator lets us know not to give up on the current run quite yet. Even though volume hasn’t been worth writing home about, %R and the moving average bullish crossover help me move back into the bullish camp and stay with the risk on trade again.

