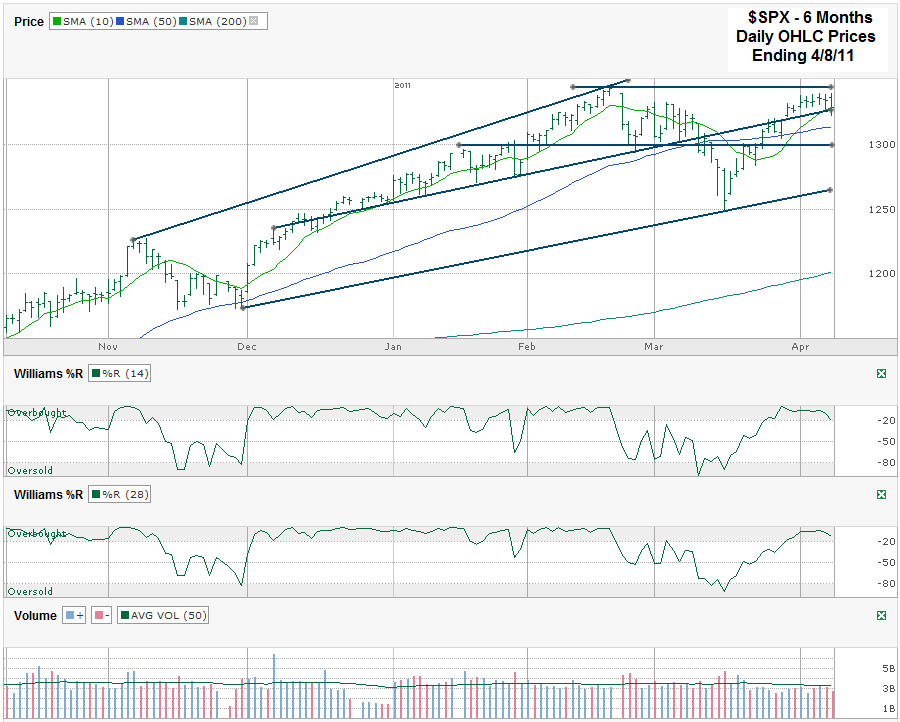
I grabbed a chart of the S&P 500 ($SPX) after it closed for the week on Friday, April 8, 2011 at 1,328.17. I’m short on time this weekend, so let me know what you think of this chart and where the technical indicators are telling us the markets will be in the short and long term.
2 thoughts on “S&P 500 Chart – Tell Me What YOU Think”
Comments are closed.


Rally into earnings… but, with QE2 ending, who’s going to buy? ‘Sell in May…’ buy again when QE3 is rumored or announced.
I’m back into an old share of mine. I haven’t been in it in about a year and a half but it came back to my attention today. I sold 2 May 37 JCI Naked Puts at $0.80 each. I believe it will be a high growth pick over the next 3-5 years.