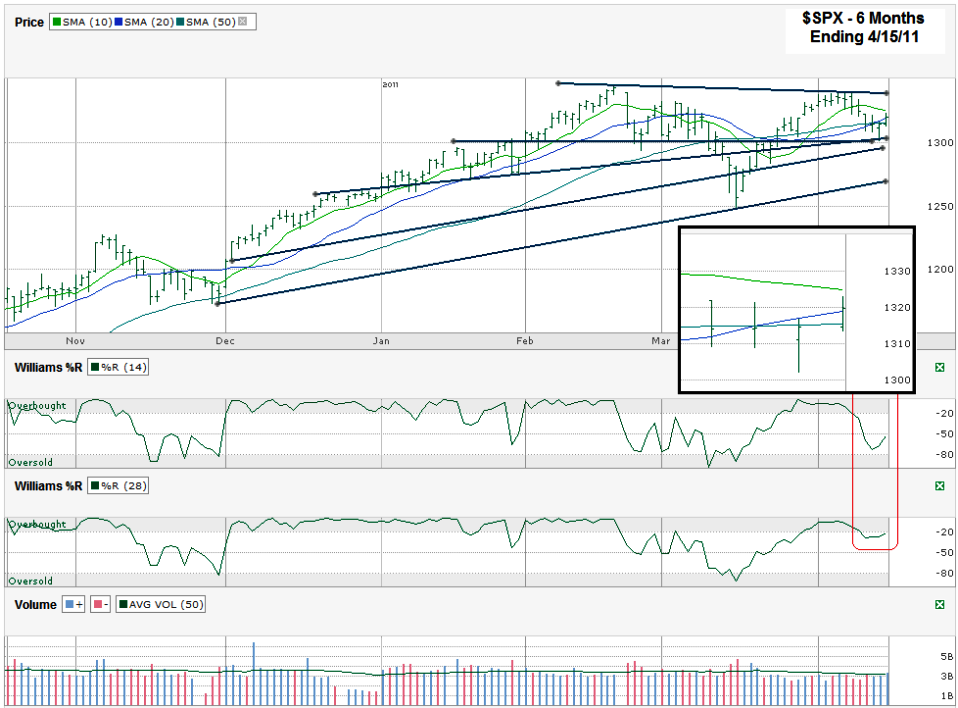
I charted the S&P 500 ($SPX) after it closed for the week on Friday, April 15, 2011 at 1,319.68.
The past week is so clogged up with moving averages crossing over near trend lines I included an inset of the past four days magnified to make it clearer how the week ended. The trend lines played a big roll in providing support this past week when the moving averages and Williams %R started to give in. Specifically the 1,300 area remains an important area to watch. It has just the round number that for some reason becomes important sometimes for indexes and also two rising trend lines of higher lows. Both of these trend lines broke in March, but still seem to be worth watching for an indication of what’s to come. They held on Friday, but that could be temporary.
The lowest trend line I drew to show the line of higher lows that hasn’t been broken puts a potential floor around 1,275 in the near term, or at least a solid speed bump. That’s only a few percent lower than Friday’s close and decently above March’s low. It could be a healthy dip. The top side resistance is even closer and marked by the line of lower highs as April’s high wasn’t able to make it back up to February’s high.
The 10, 20 and 50 day moving averages (dma) are best seen in the inset. All three are showing the index’s weakness lately. Although the 20 dma finally made it back above the 50 dma we can see the 10 dma is on its way back down and could move below the 20 dma again soon for another bearish crossover. This is always a good short term signal to me and I’ll continue to watch these two in particular. Seeing the 50 dma break intraday each of the past four days pulls me further into the bears’ camp. Friday’s recovery might be somewhat discounted since it was options expiration Friday and that can outweigh the technicals sometimes. The fact that the SPX finished on (or a hair above) the 20 dma is worth noting though, just as the 10 dma held resistance.
Williams %R gave in at the beginning of last week and spelled trouble only to see a slight move back higher on Friday. We won’t have to wait long to see if Friday’s price action was an anomaly or not. Volume did nothing to impress us for either side this week. Complacency is setting in it seems which can be bearish in its own right. For now I see a small trading range with the path of least resistance to the downside, but not too far.


I’ve just got into a new trade that I haven’t been in for quite some time – UNG. As you’re probably aware, the value of USO and UCO decays through contango as they roll their holdings from month to month.
UNG operates in a similar way, but for gas. The contango seems to have a much more negative affect on the price of UNG though – and it recently had to do a 2 for 1 reverse split.
I sold four Naked Calls for May expiry at a strike of $12. They were sold at $0.24 each ($0.23 after commissions). Should UNG close above $12, I’ll be going short 400 shares and selling Covered Put Options.
That’s probably a decent trade. I don’t like taking the naked call risk that close to the money, but all it takes is a stronger dollar and continued contango and you’re sitting on a safe trade. A dip in the market could do just the same as commodities deflate. I might have to think about BUYING some July puts.
Yeah, I’m quite happy with the trade and, hopefully, it will be the start of a profitable series on UNG.
The other trade I made today was to sell VZ Naked Puts – I’d like to have VZ as part of my CORE portfolio.