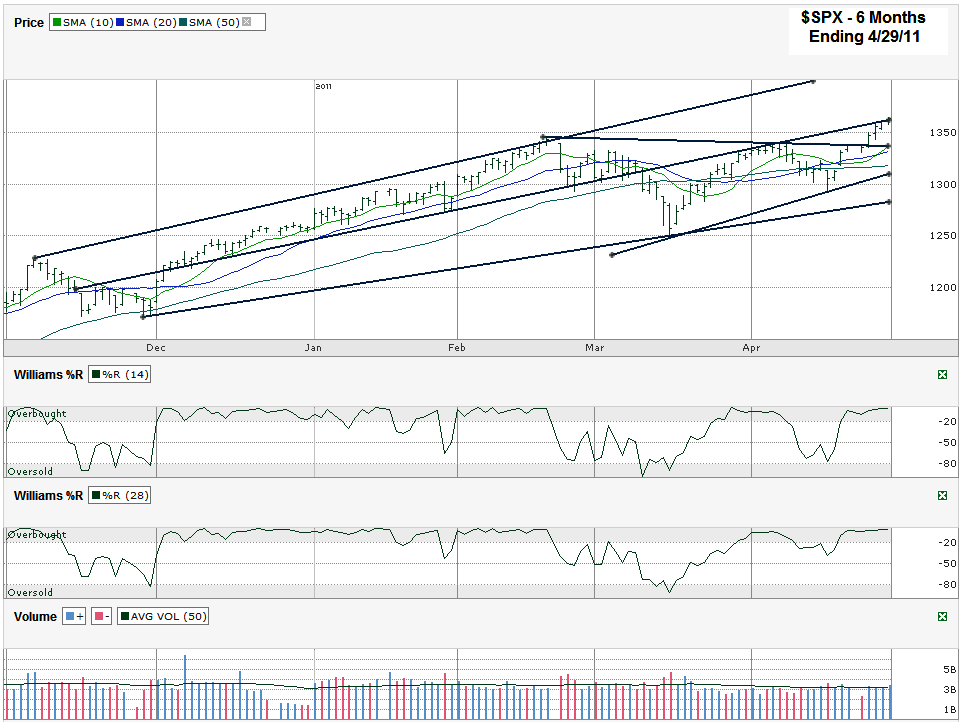
I charted the S&P 500 ($SPX) after it closed for the week on Friday, April 29, 2011 at 1,363.61.
With a third of the year in the books the stock market continues to surprise many with its endurance. As I mentioned in last week’s index chart post, I thought we were going to get a bigger fall, but once the latest bounce started all indicators pointed to better days ahead. This past week proved the technical indicators were on target. A week later not much has changed. I drew five trend lines in today’s chart. All, but one, are ascending. The one descending trend line broke this past week and now could be support if it even comes back into play. The 10 day moving average moved back above the 20 day and that’s almost always a bullish signal in my eyes. The 50 day moving average is inching higher still and could provide another good area of support on a quick profit-taking dip.
I’m not saying that every day or every week in the near term will give those of us will bullish positions bigger brokerage accounts, but the trend is certainly still alive and any dip does seem to be just another opportunity to buy in at the latest best prices. The nearest short term stick in the mud is one of the longest trend lines I drew. It’s in the middle and was support until the beginning of March when it broke and then became resistance by the end of March. That’s the line where the SPX has stopped its ascent each of the past three days and could prove to be another good place to take a breather for this rally. Again, any such break in the bull run does seem to be another buying opportunity. Even the lowest trend line of higher lows (which is slightly above the 1o0 dma – not shown) is only about 3-4% below Friday’s closing level. That’s hardly enough of a drop to cause a scare these days, but I would imagine would create a well supported entry point for many.
If you had to look for another potential weakness in the market it could come from the volume each day recently. On almost each day for the past month or so the SPX has attracted average volume on its busiest days. Most days are below average. Some will point to this to say that means there’s not a real commitment to this market. I might argue that it shows no irrational exuberance has overtaken the market yet and could lead to a more steady and continued climb higher. The Williams %R indicator supports this logic that the end is not here yet. It still points to momentum that is on the bulls’ side.
With all of those bullish thoughts in mind, I still have to remember that we’re entering May trading on Monday and the inclination to sell in May might derail the party after such a fantastic start to the year. As always, stay on your toes and keep watching the technical indicators to give us an early warning of what’s to come. What do you think, Sell in May or Stay to Play?

